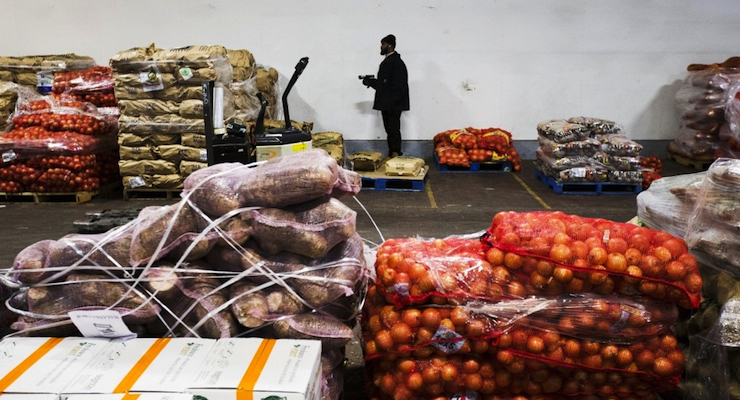

Producer Price Index (PPI): A worker in a wholesale foods production and distribution warehouse.
The Labor Department reported on Friday the Producer Price Index (PPI), a gauge of prices at the wholesale level rose 0.3% in November, beating flat expectations. The gain followed two consecutive months of decline in the PPI,
Excluding the volatile food and energy components–producer prices rose 0.3%–more than the 0.1% gain economists’ expected.
In the 12 months through November, the PPI lost 1.1% after shedding 1.6% in October. November marked the 10th straight 12-month decrease in the index. Economists had forecast the PPI unchanged last month and sliding 1.4 percent from a year ago.
| Month | Total final demand |
Final demand goods | Final demand services | Change in final demand from 12 months ago (unadj.) |
||||||
|---|---|---|---|---|---|---|---|---|---|---|
| Total | Foods | Energy | Less foods and energy |
Total | Trade | Transportation and warehousing |
Other | |||
|
2014 |
||||||||||
|
Nov. |
-0.3 | -0.8 | 0.1 | -3.7 | -0.1 | 0.0 | -0.4 | 0.3 | 0.1 | 1.3 |
|
Dec. |
-0.3 | -1.2 | -0.1 | -6.6 | 0.0 | 0.3 | 0.5 | 0.0 | 0.2 | 0.9 |
|
2015 |
||||||||||
|
Jan. |
-0.7 | -1.9 | -0.9 | -10.1 | 0.1 | -0.1 | 0.5 | -1.0 | -0.2 | 0.0 |
|
Feb. |
-0.4 | -0.4 | -1.6 | 0.0 | 0.0 | -0.5 | -1.6 | -0.9 | 0.1 | -0.5 |
|
Mar. |
0.0 | 0.1 | -1.0 | 1.2 | 0.0 | 0.1 | 0.2 | -0.3 | 0.1 | -0.9 |
|
Apr. |
-0.1 | -0.6 | -1.0 | -2.6 | 0.0 | 0.2 | -0.1 | -0.5 | 0.4 | -1.1 |
|
May |
0.5 | 1.5 | 1.4 | 6.5 | 0.2 | -0.1 | 0.1 | 0.2 | -0.1 | -0.8 |
|
June |
0.4 | 0.5 | 0.5 | 1.6 | 0.4 | 0.4 | 0.4 | 0.3 | 0.3 | -0.5 |
|
July(1) |
0.1 | -0.2 | -0.7 | -0.6 | 0.0 | 0.3 | 0.6 | 0.2 | 0.2 | -0.7 |
|
Aug.(1) |
-0.1 | -0.5 | 0.7 | -2.9 | -0.3 | 0.2 | 0.2 | -0.7 | 0.2 | -0.8 |
|
Sept. |
-0.5 | -1.2 | -0.8 | -5.9 | 0.0 | -0.4 | -0.4 | -0.7 | -0.3 | -1.1 |
|
Oct. |
-0.4 | -0.4 | -0.8 | 0.0 | -0.3 | -0.3 | -0.7 | 0.1 | -0.1 | -1.6 |
|
Nov. |
0.3 | -0.1 | 0.3 | -0.6 | -0.1 | 0.5 | 1.2 | 0.3 | 0.1 | -1.1 |
|
Footnotes |
||||||||||


