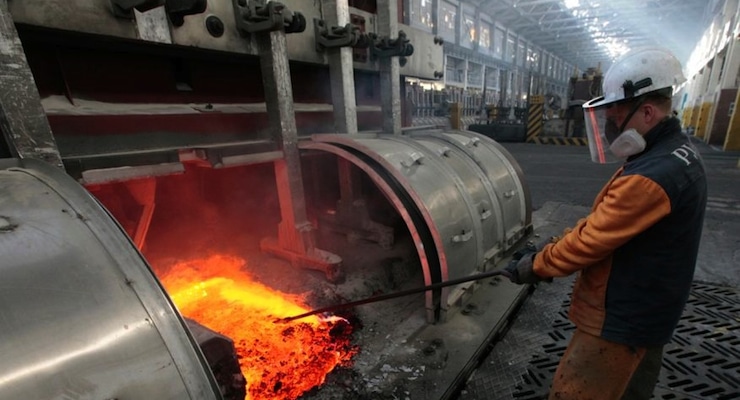

A worker in the mid-Atlantic manufacturing sector works with raw aluminum materials. (PHOTO: REUTERS)
The Philadelphia Federal Reserve said the Manufacturing Business Outlook Survey covering the mid-atlantic region tumbled to -5.9 in December from 1.9 the month prior. The gauge of manufacturing activity in the mid-Atlantic barely posted in expansion territory last month, but now came in well below the median forecast of 1.5.
Readings above 0 indicate expansion, while those below point to contraction.
The six-month outlook in the Manufacturing Business Outlook Survey turned decidedly negative in December, falling to 23.0 from 43.4. It’s the lowest reading in about three years and was fueled by firms’ predictions in steep drop-offs in new orders, shipments and pricing power. The future employment index declined to 5.5 from 13.4 in November. Producers also suggested they plan to reduce capital spending, sending that gauge down to 10.9 from 25.9.
The Philadelphia-area survey is one of several regional manufacturing reports economists and analysts use to forecast the health of the nation’s manufacturing sector as reported by the Institute of Supply Management in its monthly report next due on Jan. 4, 2016. Earlier this week, the Empire State Manufacturing Survey, which is the New York Fed’s gauge of activity in the Northeast region, remained stuck in contraction territory in December.
Manufacturing Business Outlook Survey Special Questions (Dec.)*
|
Energy
(%) |
Other Raw Materials
(%) |
Intermediate Goods
(%) |
Wages
(%) |
Health Benefits
(%) |
Nonhealth Benefits
(%) |
Wages & Health Benefits & Nonhealth Benefits
(%) |
||
|---|---|---|---|---|---|---|---|---|
|
Decline of more than 4%
|
9.4 | 10.8 | 3.1 | 0.0 | 0.0 | 0.0 | 0.0 | |
|
Decline of 3-4%
|
10.9 | 0.0 | 0.0 | 0.0 | 0.0 | 0.0 | 0.0 | |
|
Decline of 2-3%
|
9.4 | 1.5 | 1.6 | 0.0 | 0.0 | 0.0 | 0.0 | |
|
Decline of 1-2%
|
18.8 | 7.7 | 0.0 | 1.5 | 0.0 | 4.8 | 1.6 | |
|
No Change
|
32.8 | 35.4 | 46.9 | 9.2 | 7.7 | 25.8 | 3.2 | |
|
Increase of 1-2%
|
9.4 | 20.0 | 23.4 | 23.1 | 3.1 | 24.2 | 6.5 | |
|
Increase of 2-3%
|
3.1 | 13.8 | 21.9 | 49.2 | 10.8 | 27.4 | 17.7 | |
|
Increase of 3-4%
|
1.6 | 7.7 | 3.1 | 15.4 | 1.5 | 9.7 | 24.2 | |
|
Increase of 4-5%
|
1.6 | 0.0 | 0.0 | 1.5 | 15.4 | 3.2 | 24.2 | |
|
Increase of 5-7.5%
|
0.0 | 0.0 | 0.0 | 0.0 | 15.4 | 3.2 | 6.5 | |
|
Increase of 7.5-10%
|
1.6 | 1.5 | 0.0 | 0.0 | 21.5 | 0.0 | 4.8 | |
|
Increase of 10-12.5%
|
1.6 | 1.5 | 0.0 | 0.0 | 7.7 | 0.0 | 3.2 | |
|
Increase of 12.5-15%
|
0.0 | 0.0 | 0.0 | 0.0 | 6.2 | 1.6 | 4.8 | |
|
Increase of more than 15%
|
0.0 | 0.0 | 0.0 | 0.0 | 10.8 | 0.0 | 3.2 | |
| Median |
0.0 | 0.0 | 0.0 | 2.5 |
6.3 |
1.5 | 3.5 | |
| Average |
-0.7 | 0.6 |
0.8 |
2.2 |
7.5 |
1.9 | 4.8 | |
| * Percentages may not add to 100 percent because some reporters did not respond to the questions.
|
||||||||
|
Energy
(%) |
Other Raw Materials
(%) |
Intermediate Goods
(%) |
Wages
(%) |
Health Benefits
(%) |
Nonhealth Benefits
(%) |
Wages & Health Benefits & Nonhealth Benefits
(%) |
||
|---|---|---|---|---|---|---|---|---|
| Higher | 16.9 | 13.8 | 14.0 | 44.8 | 68.4 | 22.8 | 64.9 | |
| Same | 52.5 | 62.1 | 75.4 | 50.0 | 26.3 | 73.7 | 31.6 | |
| Lower | 30.5 | 24.1 | 10.5 | 5.2 | 5.3 | 3.5 | 3.5 | |
| * Percentages may not add to 100 percent because some reporters did not respond to the questions.
|
||||||||


