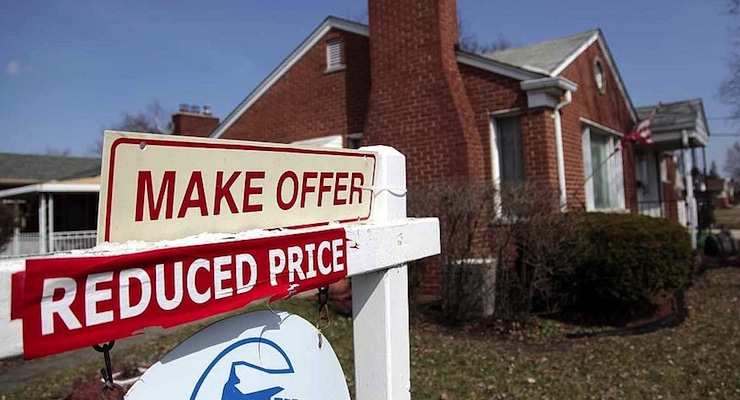
Home sales and home prices data and reports. (Photo: REUTERS)
The S&P/Case-Shiller U.S. National Home Price Index covering all nine U.S. census divisions reported a 5.2% annual gain in March, down from 5.3%. The indices found the 10-City Composite and the 20-City Composites’ year-over-year gains remained flat at 4.7% and 5.4%, respectively, from the prior month.
Home prices in 20 major U.S. metro areas rose 0.9% in March from the month prior on a non-seasonally-adjusted basis, according to the S&P/Case-Shiller home price index. The expectation was for an increase of 0.5%. From the same period a year prior, prices saw a 5.4% increase, topping expectations for a 5.2% rise.
“Home prices are continuing to rise at a 5% annual rate, a pace that has held since the start of 2015,” says David M. Blitzer, Managing Director & Chairman of the Index Committee at S&P Dow Jones Indices. “The economy is supporting the price increases with improving labor markets, falling unemployment rates and extremely low mortgage rates.”
Portland, Seattle, and Denver reported the highest year-over-year gains among the 20 cities with another month of annual price increases. Portland led the way with a 12.3% year-over-year price increase, followed by Seattle with 10.8%, and Denver with a 10.0% increase. Ten cities reported greater price increases in the year ending March 2016 versus the year ending February 2016.
“Another factor behind rising home prices is the limited supply of homes on the market,” Mr. Blitzer added. “The number of homes currently on the market is less than two percent of the number of households in the U.S., the lowest percentage seen since the mid- 1980s.”


