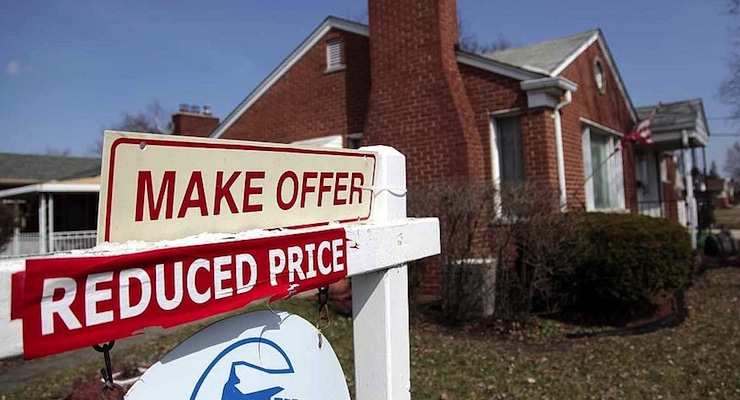

Home sales and home prices data and reports. (Photo: REUTERS)
The S&P CoreLogic Case-Shiller U.S. National Home Price Index rose 0.1% in September on a non-seasonally-adjusted basis, missing the 0.4% forecast. From the same period a year prior, prices in the 20-City Composite saw a 5.1% increase, unchanged from August and missing the median forecast of a 5.2% gain.
Still, covering all nine U.S. Census Bureau divisions, the S&P CoreLogic Case-Shiller U.S. National Home Price NSA Index showed home prices continued to rise across the country over the last 12 months and surpassed the peak set in July 2006, just before the housing boom topped out.
“The new peak set by the S&P Case-Shiller CoreLogic National Index will be seen as marking a shift from the housing recovery to the hoped-for start of a new advance,” said David M. Blitzer, Managing Director and Chairman of the Index Committee at S&P Dow Jones Indices. “While seven of the 20 cities previously reached new post-recession peaks, those that experienced the biggest booms — Miami, Tampa, Phoenix and Las Vegas — remain well below their all-time highs.”
Seattle, Portland, and Denver fueled the slight increase and each reported the highest year-over-year gains among the 20 cities over each of the last 8 months. In September, Seattle led with an 11.0% year-over-year price gain, while Portland followed closely behind with 10.9%. Denver saw an 8.7% gain.
As for the remaining surveyed, 12 cities reported greater price increases in the year ending September 2016 versus the year ending August 2016.
“Other housing indicators are also giving positive signals: sales of existing and new homes are rising and housing starts at an annual rate of 1.3 million units are at a post-recession peak,” Mr. Blitzer added.
Still, not everyone agrees with the current data and has some reason to avoid premature optimism.
The National Mortgage Risk Index (NMRI), which measures how government-guaranteed loans with an origination date in a given month would perform if subjected to the same stress as in the financial crisis that began in 2007, indicates looser and riskier lending practices are behind much of the housing market recovery. The risk indices, which include the First-Time Buyer Mortgage Share and Mortgage Risk Indices (FBMSI and FBMRI), greatly reduces the risk of sample error by covering millions of loans.
The First-Time Buyer Mortgage Share Index (FBMSI) saw loan volume surge by 14% in August on a year-over-year basis, and is now 2.5 percentage points higher than in August 2014. Total first-time buyer (FTB) volume is up 39%, which would drive home prices higher even if buyers are no more qualified to purchase them.
“Compared to two years earlier, the FTB share for August is up 2.5 percentage points,” said Ed Pinto, a resident fellow at AEI said. Mr. Pinto was a former executive vice president and chief credit officer for Fannie Mae. He added that “total FTB volume has surged 39%.”
The NMRI is similar to stress tests routinely performed by the Federal Reserve on big banks, those conducted to ascertain an automobile’s crashworthiness or a building’s ability to withstand severe hurricane force winds.
The FHA First-Time Buyer NMRI came in at 24.8% in July, up 1.0 percentage point from a year earlier, setting a series high.
“House prices will continue to rise as long as long as too much demand keeps chasing too little supply,” Tobias Peter, a senior research analyst at the International Center for Housing risk. said. “Therefore proposals such as lower mortgage insurance premiums or higher loan limits, will only stimulate more demand, worsening affordability – not improving it.”


