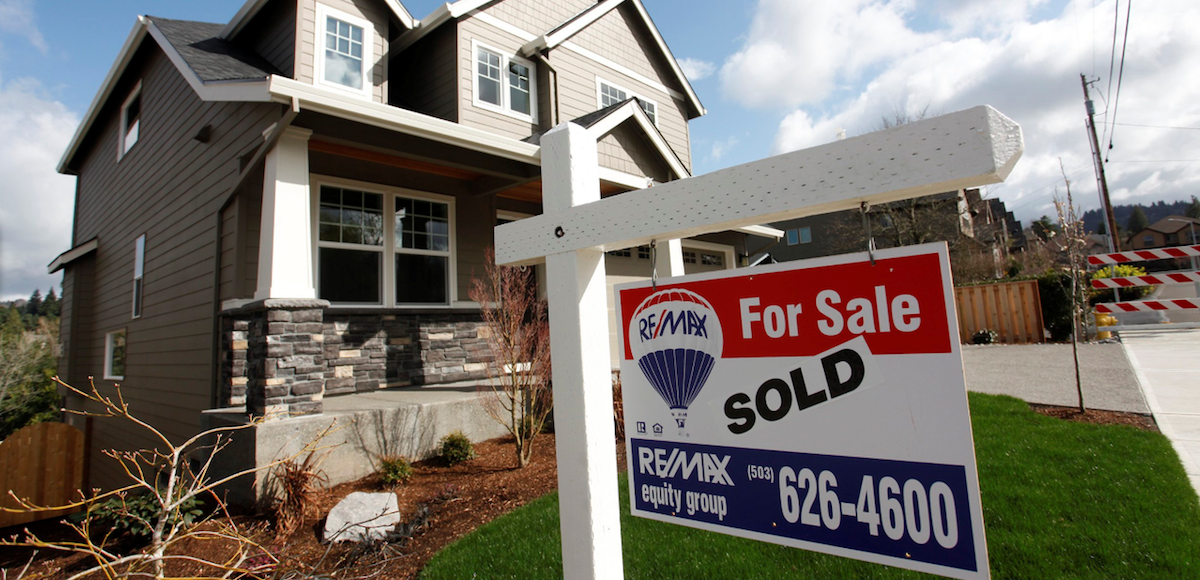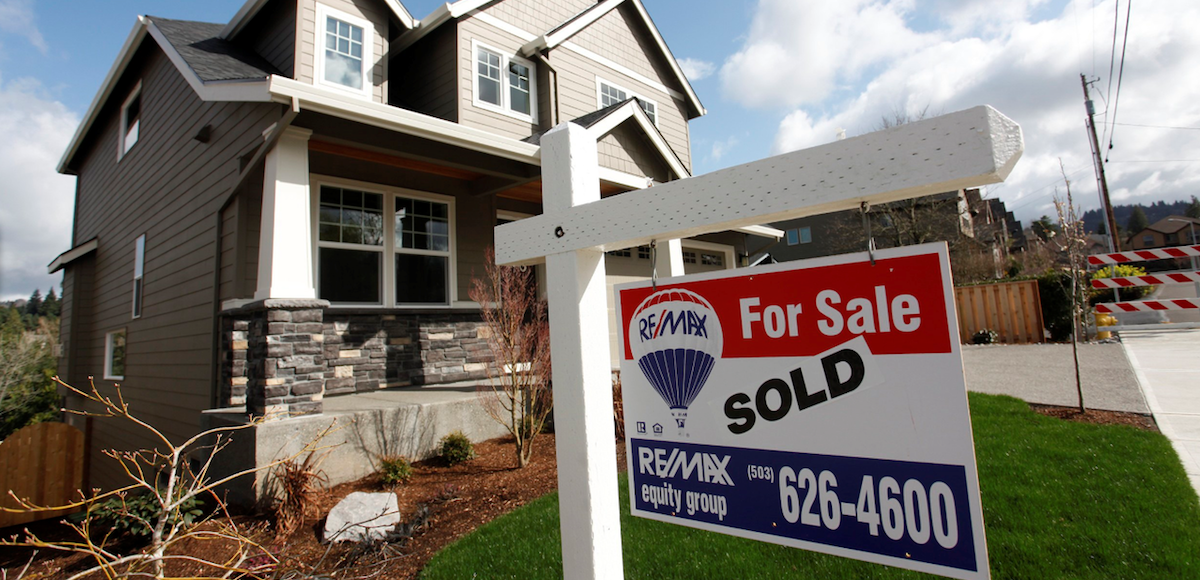

Homes are seen for sale in the northwest area of Portland, Oregon, in this file photo taken March 20, 2014. (Photo: Reuters)
The Federal Housing Finance Agency (FHFA) said Wednesday the House Price Index (HPI) found home prices rose 1.4% in the first quarter, beating the forecast. Regionally, the Pacific states led the nine regions in the report with a 1.4% monthly gain and a 7.9% year-on-year gain.
“The steep, multi-year rise in U.S. home prices continued in the first quarter,” said FHFA Deputy Chief Economist Andrew Leventis. “Mortgage rates during the quarter remained slightly elevated relative to most of last year, but demand for homes remained very strong. With housing inventories still languishing at extremely low levels, the strong demand led to another exceptionally large quarterly price increase.”
Significant Findings
- Home prices rose in 48 states and the District of Columbia between the first quarter of 2016 and the first quarter of 2017. The top five areas in annual appreciation were: 1) District of Columbia 13.9%; 2) Colorado 10.7%; 3) Idaho 10.3%; 4)Washington 10.2%; and 5) New Hampshire 9.5%.
- Among the 100 largest metropolitan areas in the U.S., annual price increases were greatest in the Grand Rapids-Wyoming, MI, where prices increased by 13.7%. Prices were weakest in San Francisco-Redwood City-South San Francisco, CA (MSAD), where they fell 2.5%.
- Of the nine census divisions, the Pacific division experienced the strongest increase in the first quarter, posting a 2.0% quarterly increase and a 7.7% increase since the first quarter of last year. House price appreciation was weakest in theMiddle Atlantic division, where prices rose 1.0% from the last quarter.
The Federal Housing Finance Agency (FHFA) House Price Index (HPI) covers single-family housing, using data provided by Fannie Mae and Freddie Mac.
[brid video=”141928″ player=”2077″ title=”FHFA Deputy Chief Economist Talks Q1 2017 House Price Index”]


