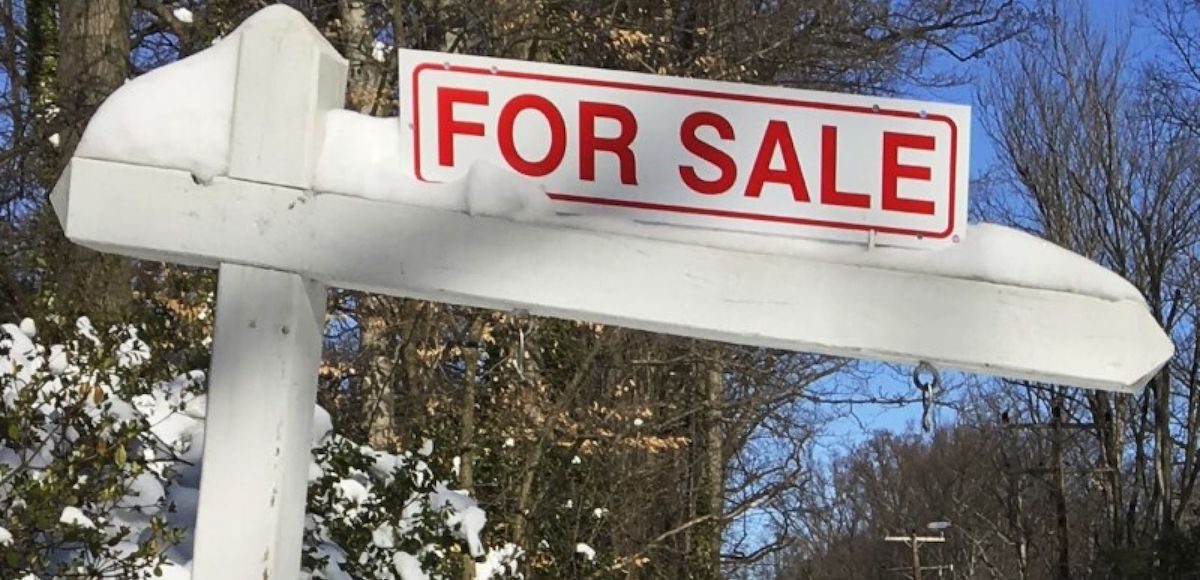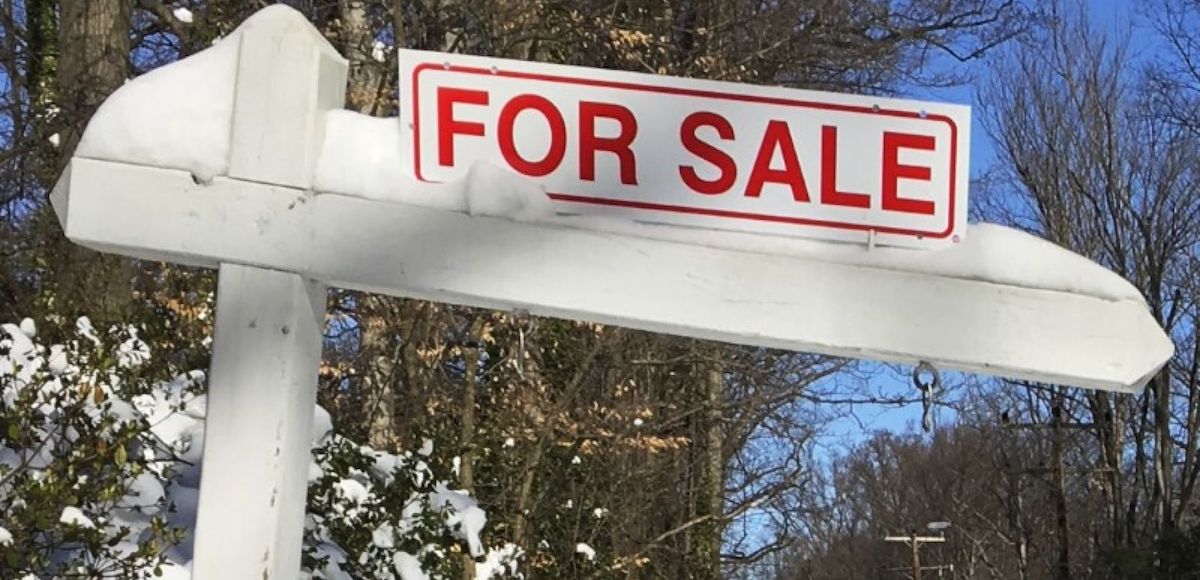

A house-for-sale sign is seen inside the Washington DC Beltway in Annandale, Virginia January 24, 2016. (Photo: Reuters)
The Federal Housing Finance Agency (FHFA) House Price Index (HPI) rose by just 0.4% in May, while house prices were up 6.9% on a yearly basis. The annual rise is the strongest in roughly 3 1/2 years, though the last two months have shown weakness.
For the 9 census divisions, seasonally adjusted monthly price changes from April 2017 to May 2017 ranged from -0.5% in the Middle Atlantic division to +1.0% in the West South Central division. The 12-month changes were all positive, ranging from +4.0% in the Middle Atlantic division to +8.7% in the Pacific division.


