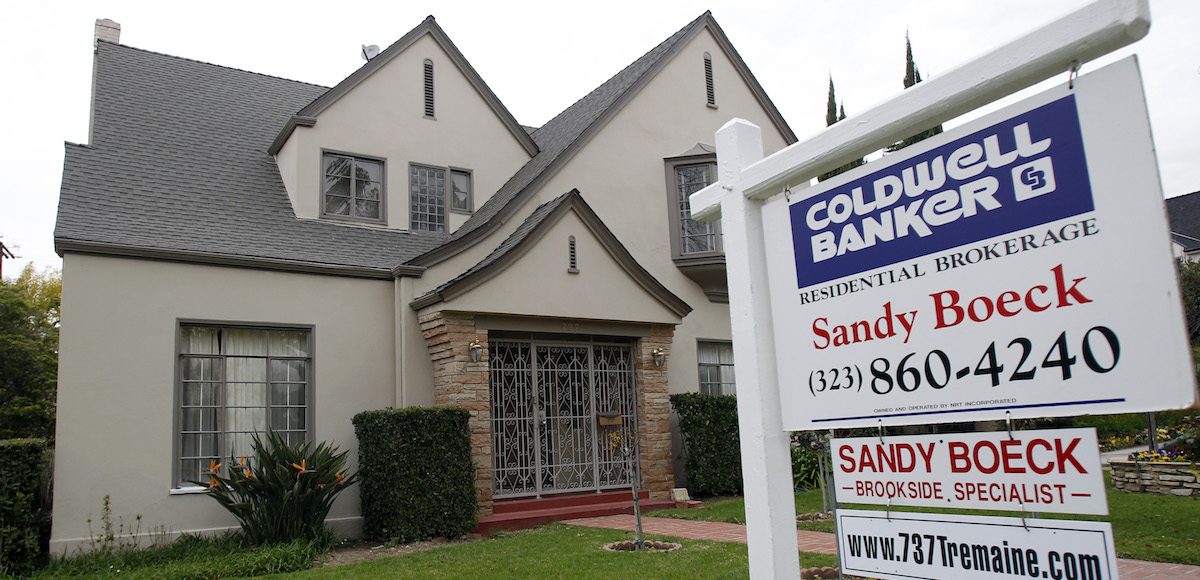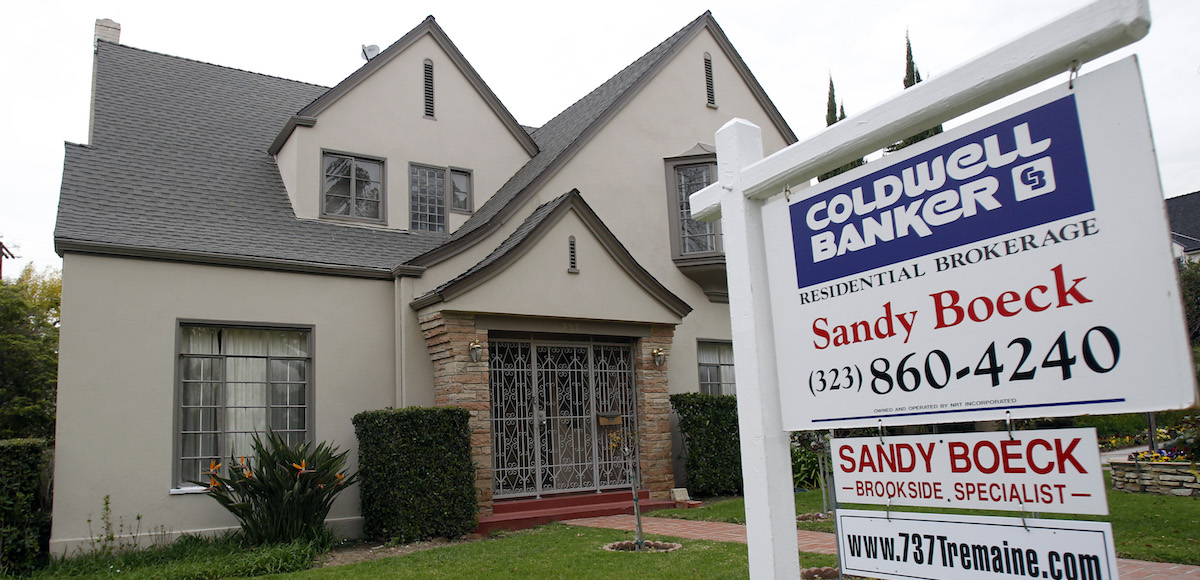

A view of a house for sale is seen in Los Angeles on February 24, 2010. (Photo: Reuters)
The S&P CoreLogic Case-Shiller Home Price Index (NSA), covering all 9 U.S. census divisions, reported a 5.8% annual gain in June, up from 5.7% the previous month.The 10-City Composite posted a 4.9% annual increase, down from 5.0% the previous month.
“The trend of increasing home prices is continuing,” says David M. Blitzer, Managing Director and Chairman of the Index Committee at S&P Dow Jones Indices. “Price increases are supported by a tight housing market. Both the number of homes for sale and the number of days a house is on the market have declined for four to five years.”
The 20-City Composite reported a 5.7% year-over-year gain, the same as the previous month. Seattle, Portland, and Dallas reported the highest year-over-year gains among the 20 cities. In June, Seattle led the way with a 13.4% year-over-year price increase, followed by Portland with 8.2%, and Dallas with a 7.7% increase. Nine cities reported greater price increases in the year ending June 2017 versus the year ending May 2017.
While home prices in Chicago and Cleveland have been declining in recent months and New York and Atlanta weakening, western cities along with Miami and Tampa (Fla.) continue to show strength.
The months-supply of existing homes for sale is low, at 4.2 months. Though the report shows a bit of a cooling in June, home prices remain a strength in what is now a low interest-rate, low inflation economy. Lower prices will give a net plus to home sales as it gives first-time buyers a better chance at buying a home.
“In addition, housing starts remain below their pre-financial crisis peak as new home sales have not recovered as fast as existing home sales,” Mr. Blitzer added. “Rising prices are the principal factor driving affordability down.”
The National Index posted an unadjusted month-over-month gain of 0.9% in June, with the 10-City and 20-City Composites both reporting a 0.7% increase in June. Seasonally adjusted, the National Index posted a 0.4% month-over-month increase, while the 10-City Composite remained stagnant with no month-over-month increase. The 20-City Composite recorded a 0.1% month-over-month increase and all 20 cities reported increases in June before seasonal adjustment.
After seasonal adjustment, 14 cities saw prices rise.
“However, other drivers of affordability are more favorable: the national unemployment rate is down, and the number of jobs created continues to grow at a robust pace, rising to close to 200,000 per month,” Mr. Blitzer concluded. “Wages and salaries are increasing, maintaining a growth rate a bit ahead of inflation. Mortgage rates, up slightly since the end of 2016, are under 4%. Given current economic conditions and the tight housing market, an immediate reversal in home price trends appears unlikely.”


