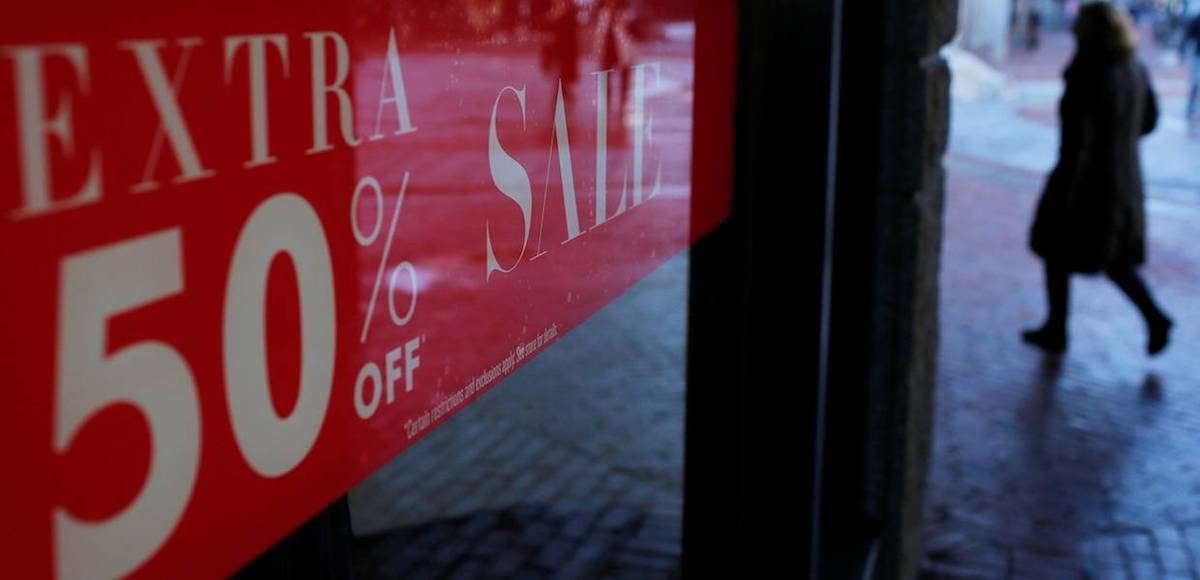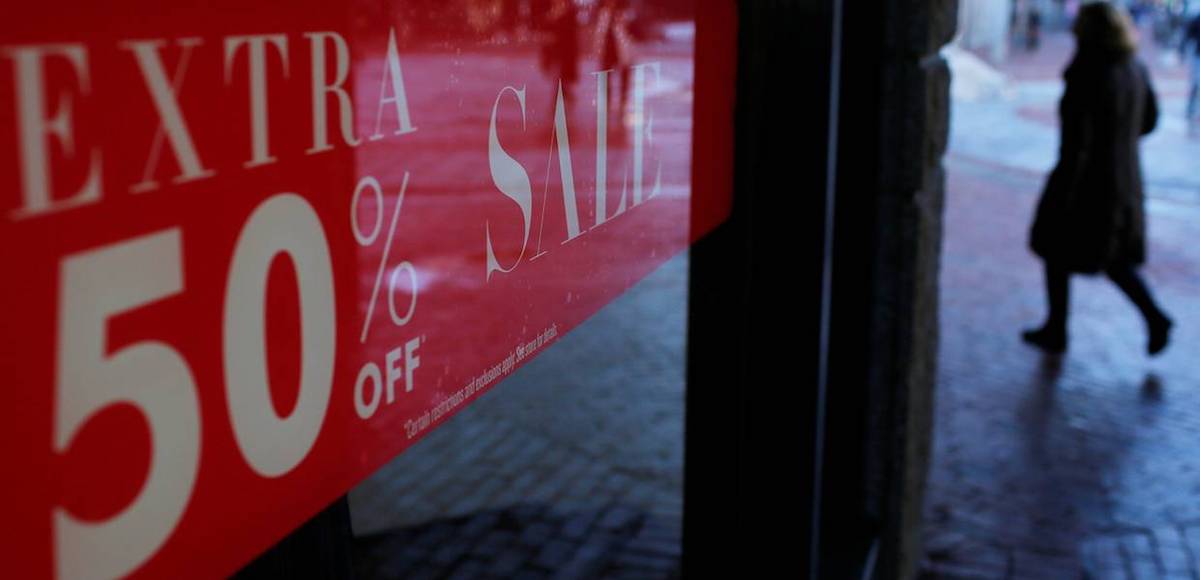

A shopper passes a ”Sale” sign at Quincy Market in downtown in Boston, Massachusetts, U.S. January 11, 2017. (Photo: Reuters)
While often volatile, the U.S. Census Bureau said advanced estimates for retail sales were $474.8 billion, down 0.2% (±0.5%) from last month. However, retail sales were still estimated 3.2% (±0.7%) higher than in August 2016.
Total sales from June 2017 through August 2017 were up 3.2% (±0.7%) from the same period a year ago. The period from June 2017 to July 2017 was revised down from 0.6% (±0.5%) to up 0.3% (±0.1%).
Retail trade sales were down 0.3% (±0.5%) from July 2017, and up 3.3% (±0.7%) from last year. Non-store Retailers were up 8.4% (±1.6%) from August 2016, while Building Materials and Garden Equipment and Supplies Dealers were up 7.5% (±1.9%) from last year.
Overall, there are signs of fundamental underlaying strengths in consumer spending. Restaurant sales rose 0.3%, furniture was up 0.4% and general merchandise pulled out of contraction to 0.2%.


