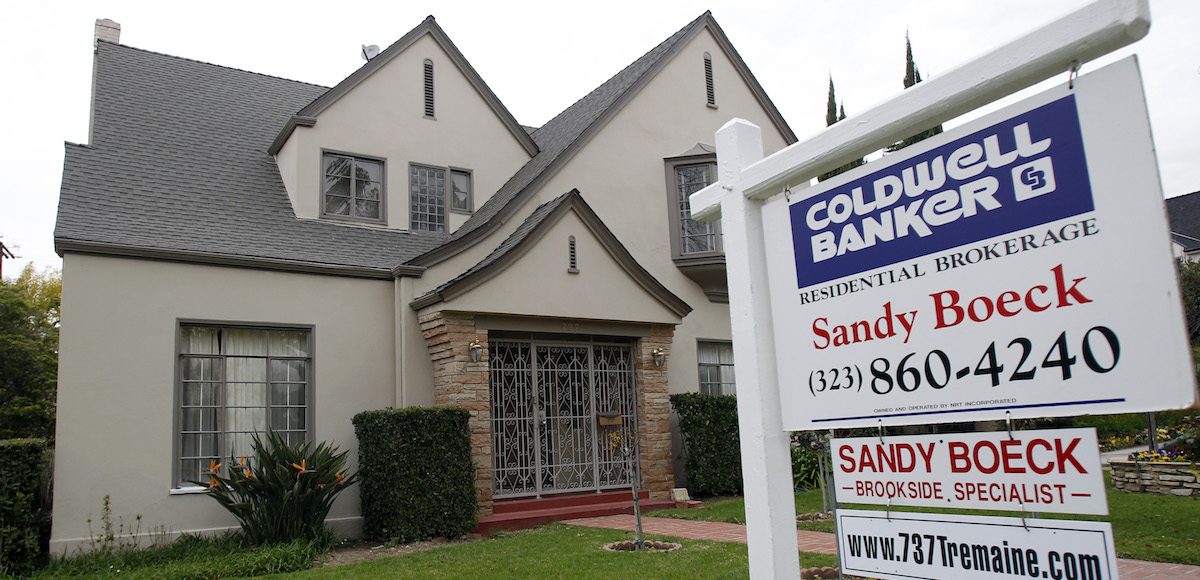

A view of a house for sale is seen in Los Angeles on February 24, 2010. (Photo: Reuters)
The Federal Housing Finance Agency (FHFA) House Price Index (HPI) rose 1.4% in the third quarter (3Q) of 2017 and by a seasonally adjusted 0.3% from August. The HPI is calculated using home sales price information from mortgages sold to, or guaranteed by, Fannie Mae and Freddie Mac.
“With relatively favorable economic conditions and a continued shortage of housing supply, price increases in the third quarter were generally robust and widespread,” said Andrew Leventis, Deputy Chief Economist. “At some point, declining housing affordability should temper appreciation rates in some of the nation’s fastest appreciating markets, but our third quarter results show few signs of that.”
Of the 9 U.S. census divisions, the Pacific division experienced the strongest annual appreciation. The region saw an 8.9% increase since the 3Q of last year and a 1.7% gain since the 2Q of 2017. House price appreciation was weakest in the Middle Atlantic division, where prices still rose considerably by 4.8% on an annual basis.
While home prices increased in each of the 100 largest metropolitan areas in the U.S. over the last four quarters, annual price gains were strongest in the Seattle-Bellevue-Everett, WA (MSAD), where prices increased by 14.6%. Prices were weakest in Camden, NJ (MSAD), where they rose 0.5%.
The appreciation of home prices and strength in the housing market driven by a stronger labor market and interest rates is one of the biggest economic stories of 2017. The S&P CoreLogic Case-Shiller Home Price Index (HPI), which covers all 9 U.S. census divisions and was also released Tuesday morning, continued to show strong gains, as well. It has hit all-time highs in 2017.
Below is a video demonstrating the basic methodology behind the Federal Housing Finance Agency (FHFA) House Price Index (HPI).


