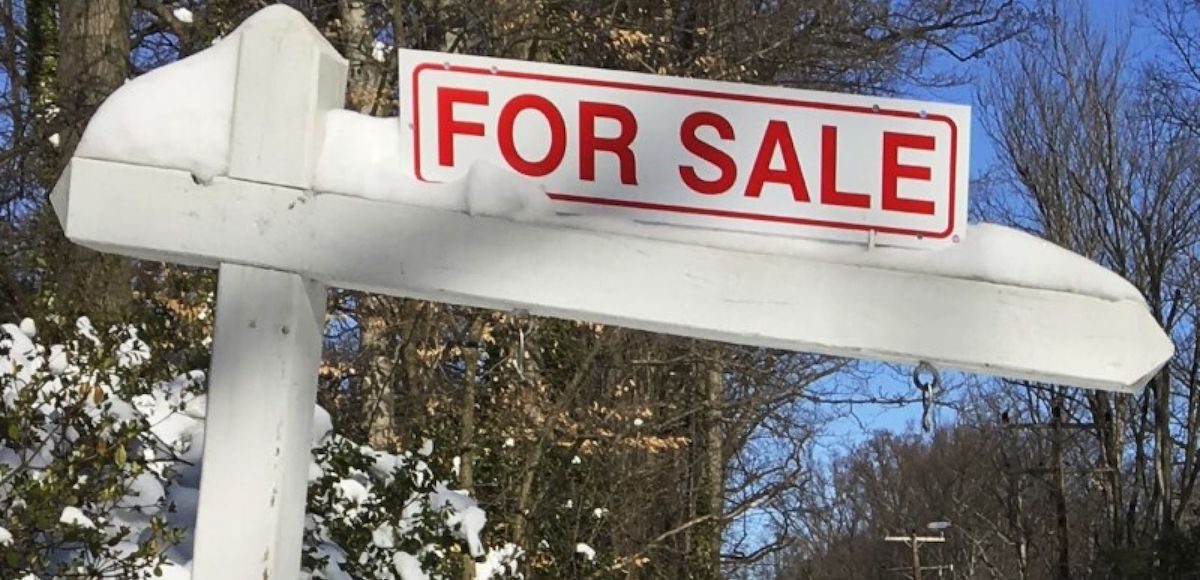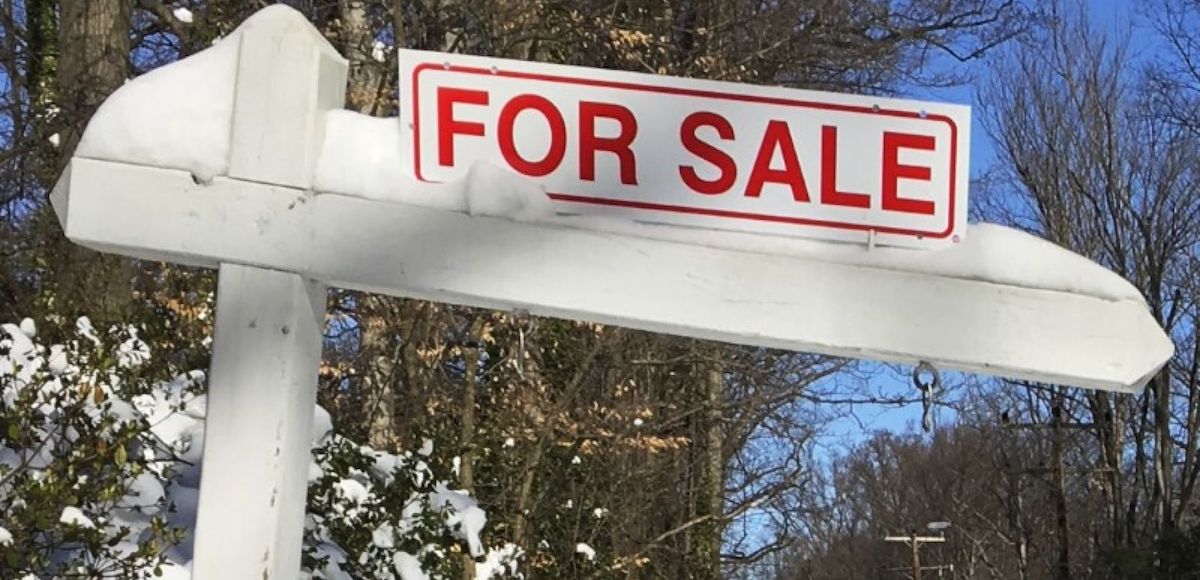

A house-for-sale sign is seen inside the Washington DC Beltway in Annandale, Virginia January 24, 2016. (Photo: Reuters)
The S&P CoreLogic Case-Shiller U.S. National Home Price NSA Index, which covers all nine U.S. census divisions, gained 6.2% annually in October 2017. The 10-City and 20-City Composites reported year-over-year increases of 6.0% and 6.4%, respectively.
“Home prices continue their climb supported by low inventories and increasing sales,” says David M. Blitzer, Managing Director & Chairman of the Index Committee at S&P Dow Jones Indices. “Nationally, home prices are up 6.2% in the 12 months toOctober, three times the rate of inflation.”
Seattle, Las Vegas, and San Diego reported the highest year-over-year gains among the 20 cities. In October, Seattle led the way with a 12.7% year-over-year price increase, followed by Las Vegas with a 10.2% increase, and San Diego with an 8.1% increase. Nine cities reported greater price increases in the year ending October 2017 versus the year ending September 2017.
Sales of existing homes dropped 6.1% from March through September; they have since rebounded8.4% in November. Inventories measured by months-supply of homes for sale dropped from the tight level of 4.2 months last summer to only 3.4 months in November.
“Underlying the rising prices for both new and existing homes are low interest rates, low unemployment and continuing economic growth. Some of these favorable factors may shift in 2018,” Mr. Blitzer added. “The Fed is widely expected to raise the Fed funds rate three more times to reach 2% by the end of the New Year.Since home prices are rising faster than wages, salaries, and inflation, some areas could see potential home buyers compelled to look at renting. Data published by the Urban Institute suggests that in some West coast cities with rapidly rising home prices, renting is more attractive than buying.”


