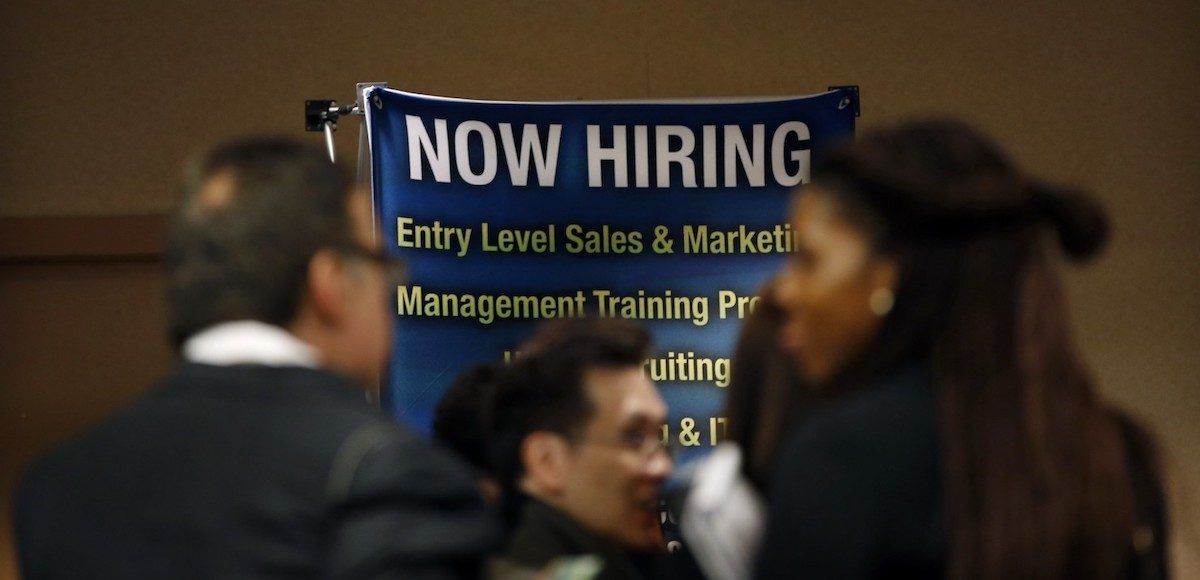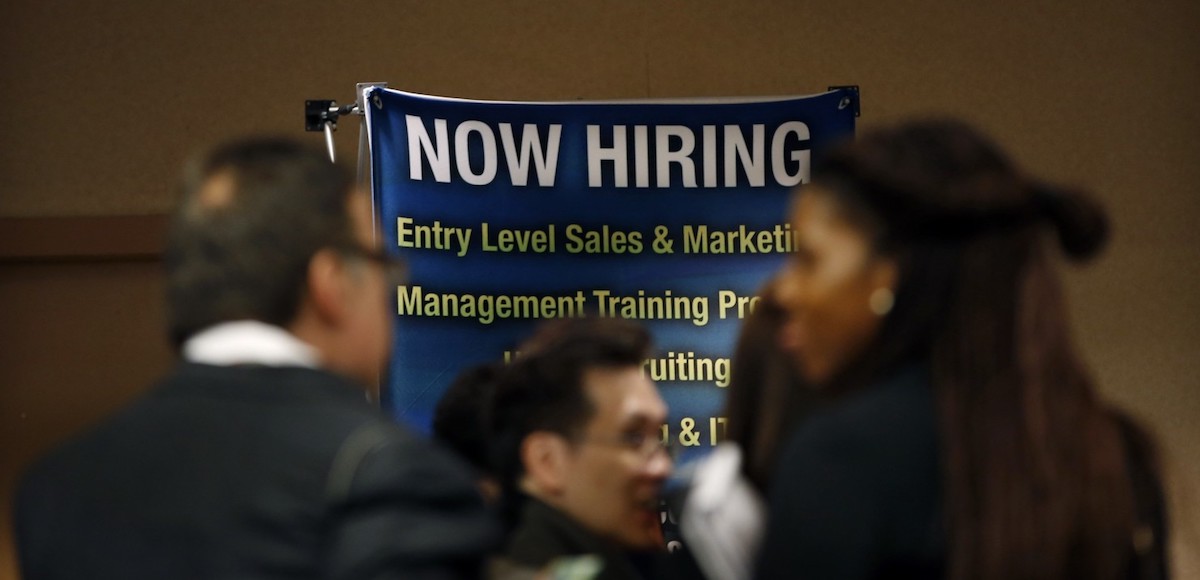

Job seekers wait to meet with employers at a career fair in New York City, October 24, 2012. (Photo: Reuters)
The Labor Department said first-time applications for jobless claims fell to a seasonally adjusted 221,000 for the week ending February 3, down 9,000 from the previous week’s unrevised level at 230,000.
The 4-week average fell to 224,500, a decrease of 10,000 from the previous week’s unrevised average of 234,500. This is the lowest level for this average since March 10, 1973 when it was 222,000.
The labor market is almost at full employment, with the jobless rate at a 17-year low of 4.1%. The tight labor market and strong labor demand is starting to exert upward pressure on wage growth. The latest jobs report on the employment situation in January was stronger than expected and showed what now appears to be a trend for rising wages.
The advance number for seasonally adjusted insured unemployment during the week ending January 27 was 1,923,000, a decrease of 33,000 from the previous week’s revised level. The previous week’s level was revised up 3,000 from 1,953,000 to 1,956,000.
The 4-week moving average was 1,946,000, an increase of 12,500 from the previous week’s revised average. The previous week’s average was revised up by 750 from 1,932,750 to 1,933,500.
The highest insured unemployment rates in the week ending January 20 were in the Virgin Islands (15.4), Puerto Rico (4.8), Alaska (4.3), Connecticut (3.0), New Jersey (3.0), Montana (2.9), Rhode Island (2.9), Pennsylvania (2.8), Massachusetts (2.6), and Illinois (2.5).
The largest increases in initial claims for the week ending January 27 were in Missouri (+6,132), Georgia (+3,060), Pennsylvania (+1,586), Texas (+1,482), and North Carolina (+1,237), while the largest decreases were in California (-2,687), Michigan (-1,949), New Jersey (-1,825), Ohio (-838), and South Carolina (-713).


Release the IG Report Shinobi / February 8, 2018
What a tyrant we have in the WH
/