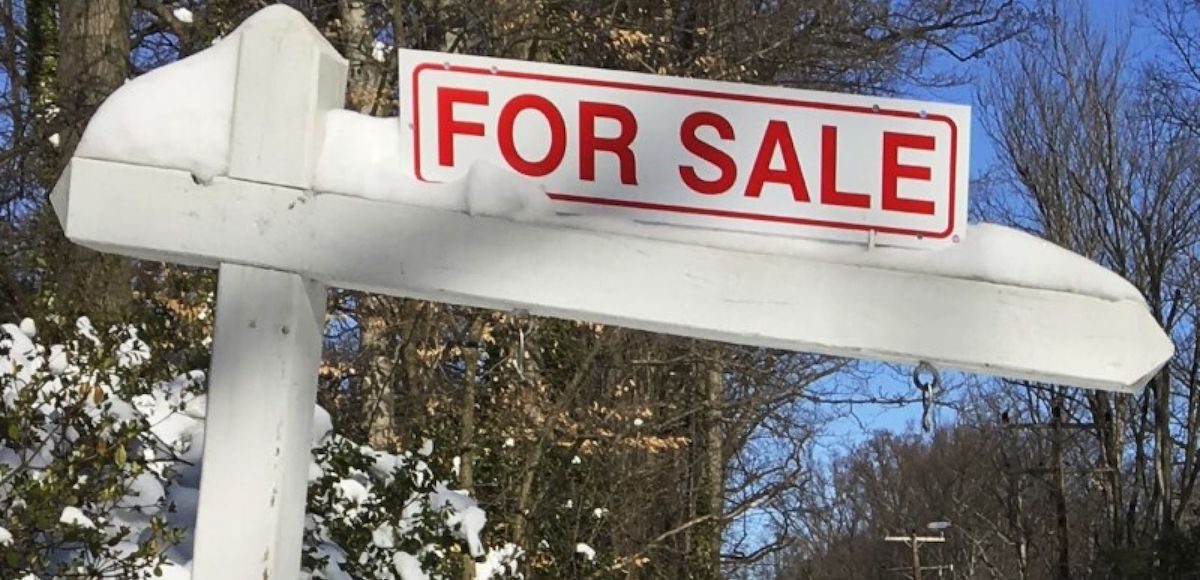

A house-for-sale sign is seen inside the Washington DC Beltway in Annandale, Virginia January 24, 2016. (Photo: Reuters)
The Federal Housing Finance Agency (FHFA) House Price Index (HPI) rose 1.6% in the fourth quarter (4Q) of 2017 and house prices were up 6.7% from 4Q 2016 to 4Q 2017. FHFA’s seasonally adjusted monthly index for December was up 0.3% from November, juxtaposed to a 0.6% median forecast.
The HPI is calculated using home sales price information from mortgages sold to, or guaranteed by, Fannie Mae and Freddie Mac. Worth noting, in a rare exception to the S&P CoreLogic Case-Shiller U.S. National Home Price NSA Index also released Tuesday, the West showed slightly less strength in the HPI. Meanwhile, the Mountain and Pacific regions took the lead in gains.
“The fourth quarter showed absolutely no letup in the remarkable pace of home price appreciation through the country, “said Andrew Leventis, Deputy Chief Economist. “As we begin to track home prices in the first quarter, we will be interested to see whether new headwinds—higher mortgage rates and changes in tax laws—will lead to any moderation in the rate of price growth.”
Significant Findings Via FHFA
- Home prices rose in 49 states (all except Mississippi) and the District of Columbia between the fourth quarter of 2016 and the fourth quarter of 2017. The top five areas in annual appreciation were: 1) District of Columbia 14.3 percent; 2) Washington 12.0 percent; 3) Idaho 11.5 percent; 4) Nevada 11.5 percent; and 5) Utah 10.7 percent.
- Home prices rose in each of the 100 largest metropolitan areas in the U.S. over the last four quarters. Annual price increases were greatest in the Seattle-Bellevue-Everett, WA (MSAD), where prices increased by 15.0 percent. Prices were weakest in San Francisco-Redwood City-South San Francisco, CA (MSAD), where they rose 0.5 percent.
- Of the nine census divisions, the Mountain division experienced the strongest annual appreciation, posting an 8.8 percent gain since the fourth quarter of last year and a 2.3 percent increase since the third quarter of 2017. Annual house price appreciation was weakest in the Middle Atlantic division, where prices rose 5.3 percent annually.


Tidal Wave / February 27, 2018
Buy real estate!!! I expect prices to dip in DC—due to an ⬆️ in inventory in late 2018
/