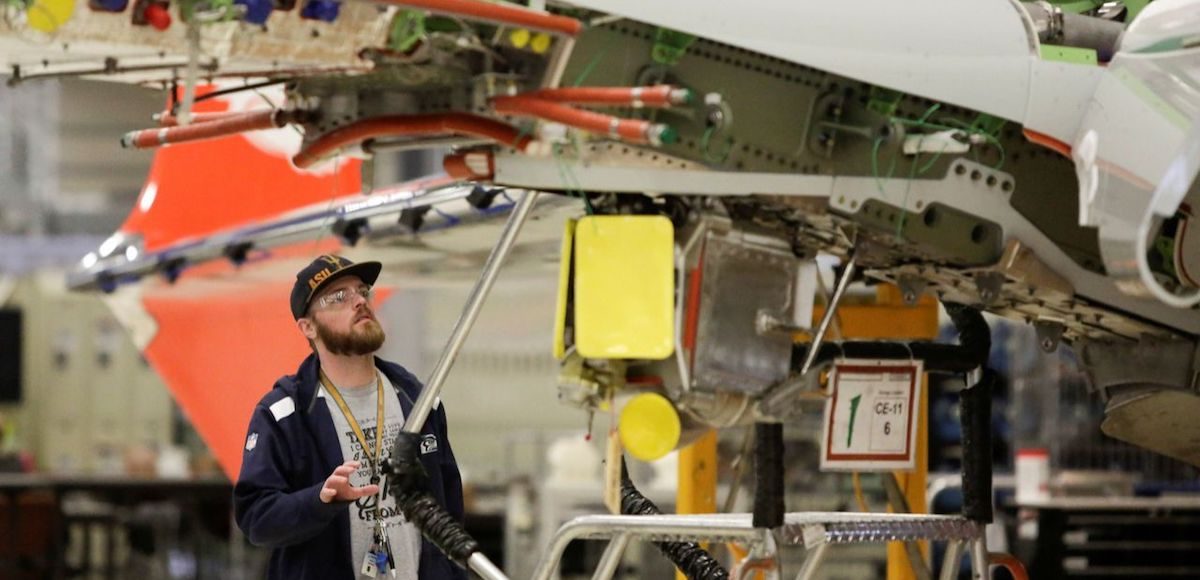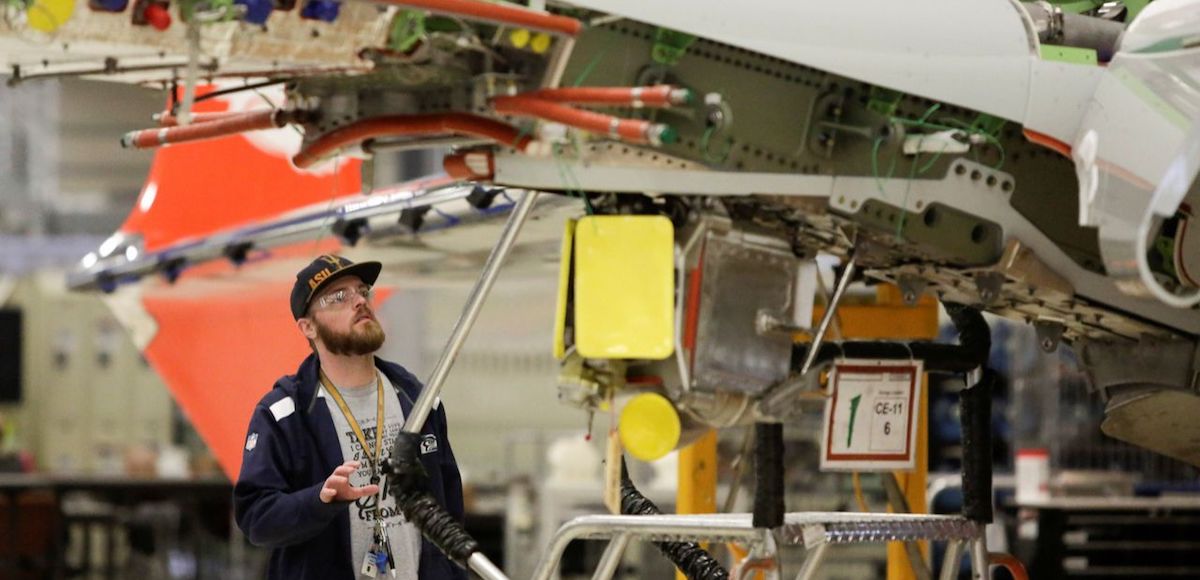

A Boeing worker is pictured in the wing system installation area at their factory in Renton, Washington, U.S., February 13, 2017. (Photo: Reuters)
News orders for durable goods in the U.S. bounced back strong in February, increasing $7.4 billion, or 3.1% to $247.7 billion. The increase, which easily beat the median forecast, marks the third in four months and erased nearly all the losses from the 3.5% decline in January.
More on New Orders
Excluding transportation, new orders still increased 1.2%. Excluding defense, new orders still increased 2.5%. Transportation equipment, also up three of the last four months, led the increase, $5.5 billion or 7.1% to $83.5 billion.
Shipments
Shipments of manufactured durable goods, which has been up 9 of the last 10 months, gained by 0.9%, or $2.2 billion to $249.7 billion. It follows a 0.5% increase last month. Machinery, up 6 of the last 7 months, led the gain, rising 1.8% or $0.6 billion to $33.4 billion.
Unfilled Orders
Unfilled orders for manufactured durable goods have now risen for 5 of the last 6 months. In February, they increased $2.3 billion or 0.2% to $1,143.3 billion following a 0.3% increase in January. Transportation equipment has been up 2 of the last 3 months and led the increase this month. Transportation is up $1.4 billion or 0.25 to $773.2 billion.
Inventories
Inventories of manufactured durable goods have now risen for 19 of the last 20 months and gained $1.6 billion, or 0.4% to $410.6 billion in February. This follows a 0.4% increase in January. Transportation equipment, up 3 consecutive months, led the gain by $0.7 billion or 0.6% to $132.7 billion.
Capital Goods
Non-defense new orders for capital goods increased $3.3 billion, or 4.5% to $77.4 billion. Shipments gained $0.9 billion, or 1.2% to $75.3 billion. Unfilled orders rose $2.1 billion or 0.3% to $708.6 billion. Inventories gained $1.0 billion or 0.6% to $183.1 billion.
Defense new orders for capital goods increased $1.5 billion or 16.5% to $10.7 billion. Shipments decreased $0.4 billion or 3.6% to $11.1 billion. Unfilled orders decreased $0.4 billion or 0.3% to $140.6 billion. Inventories gained by less than $0.1 billion or 0.2% to $23.2 billion.
Revisions
The data for new orders in January was revised up slightly to $491.9 billion from $491.7 billion. Shipments were also revised up slightly to $499.2 billion from $498.8. Meanwhile, unfilled orders, at $1,141.0 billion, were revised down slightly from $1,141.2 billion. Total inventories were revised slightly higher to $672.6 billion from $672.4 billion in January.


