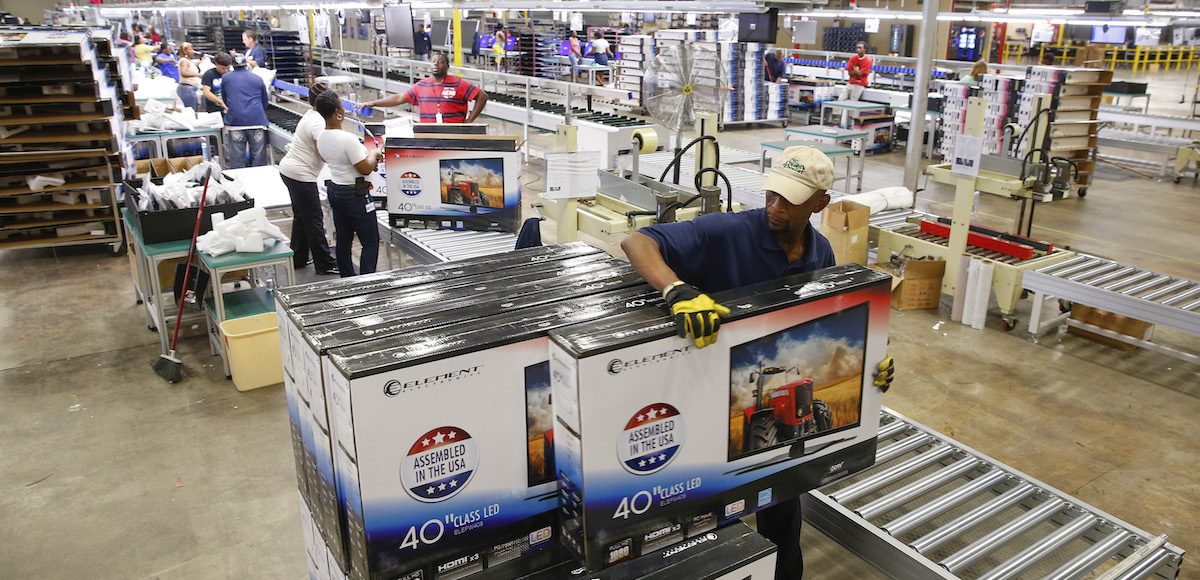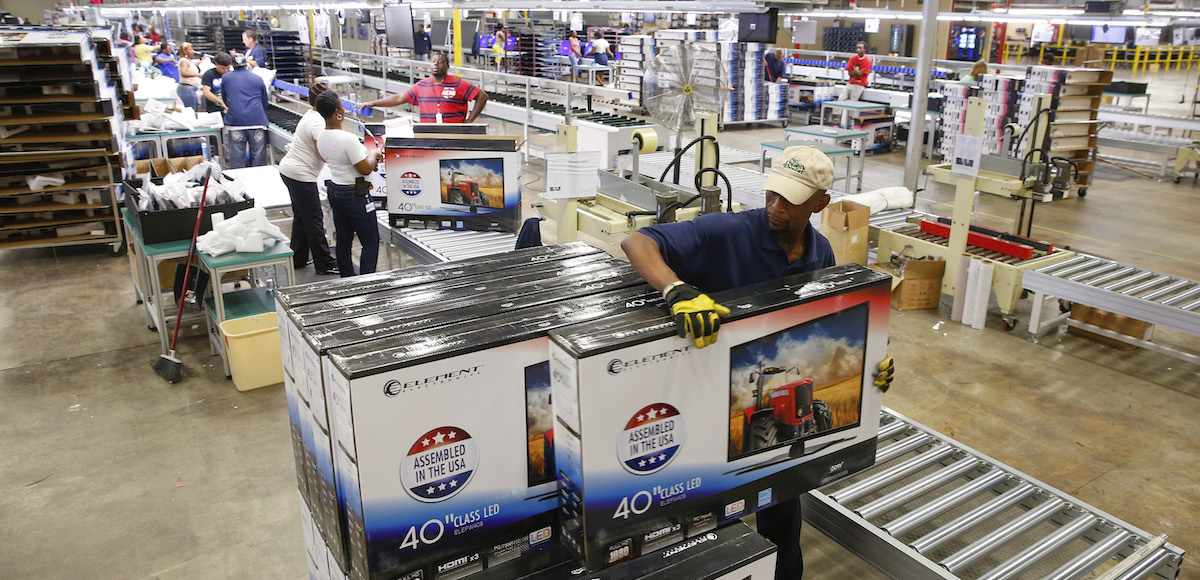

A worker stacks boxes of television sets after they have been assembled, checked and repackaged, before moving them to the warehouse at Element Electronics in Winnsboro, South Carolina May 29, 2014. (Photo: Reuters)
The U.S. Census Bureau said business inventories rose 0.6% in February for a second straight month in February. That compares to a 3Q average monthly build of 0.3%, indicating business inventories will be a big contributor to first-quarter (1Q) gross domestic product (GDP).
Sales
The combined value of distributive trade sales and manufacturers’ shipments for February, adjusted for seasonal and trading-day differences but not for price changes, was estimated at $1,430.4 billion, up 0.4% (±0.2%) from January 2018 and was up 5.8% (±0.3%) from February 2017
Inventories
Manufacturers’ and trade inventories, adjusted for seasonal variations but not for price changes, were estimated at an end-of-month level of $1,928.8 billion, up 0.6% (±0.1%) from January 2018 and were up 4.0% (±0.3%) from February 2017.
Inventories/Sales Ratio
The total business inventories/sales ratio based on seasonally adjusted data at the end of February was 1.35. The February 2017 ratio was 1.37


