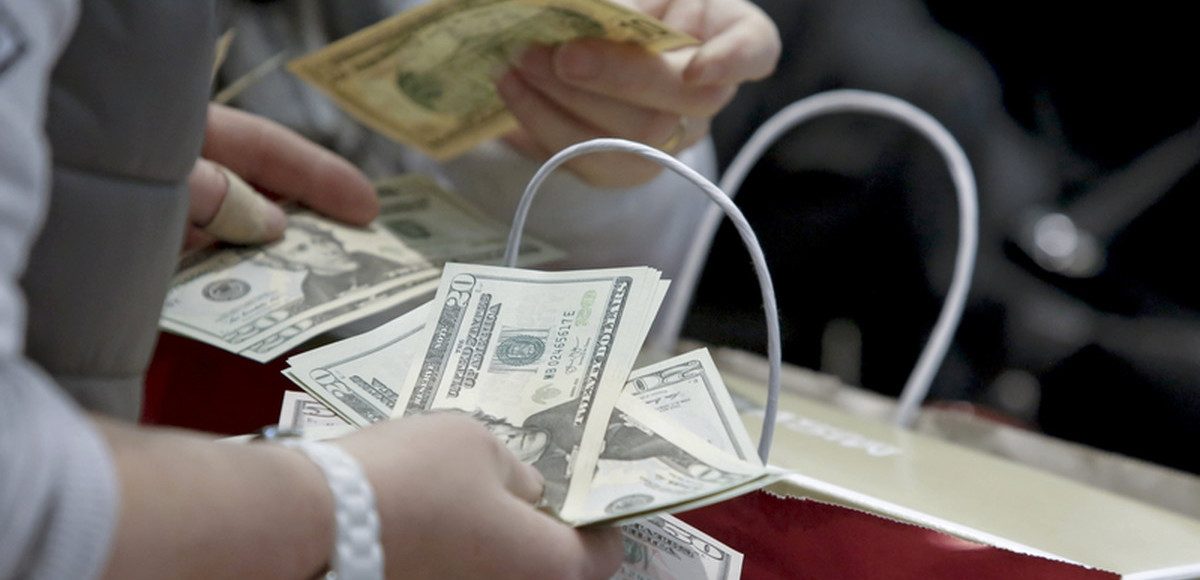

People count money at Macy’s Herald Square store during the early opening of the Black Friday sales in the Manhattan borough of New York, November 26, 2015. (Photo: Reuters)
The Bureau of Economic Analysis (BEA) unpacked September’s contribution to Q3 2018 GDP from personal income and outlays. According to estimates, personal income rose $35.7 billion (0.2%), disposable personal income (DPI) gained $29.1 billion (0.2%) and personal consumption expenditures (PCE) increased $53.0 billion (0.4%).
Stripping out the impact from the Tax Cuts and Jobs Act (TCJA), personal income only rose 0.1%.
Real DPI increased 0.1% in September and Real PCE rose 0.3%. The PCE price index increased 0.1%. Excluding food and energy, the PCE price index increased 0.2%.
[su_table responsive=”yes”]
| 2018 | |||||
|---|---|---|---|---|---|
| May | Jun | Jul. | Aug. | Sept. | |
| Percent change from preceding month | |||||
| Personal income: | |||||
| Current dollars | 0.4 | 0.4 | 0.3 | 0.4 | 0.2 |
| Disposable personal income: | |||||
| Current dollars | 0.4 | 0.4 | 0.3 | 0.4 | 0.2 |
| Chained (2012) dollars | 0.2 | 0.3 | 0.2 | 0.2 | 0.1 |
| Personal consumption expenditures (PCE): | |||||
| Current dollars | 0.5 | 0.4 | 0.5 | 0.5 | 0.4 |
| Chained (2012) dollars | 0.3 | 0.3 | 0.3 | 0.4 | 0.3 |
| Price indexes: | |||||
| PCE | 0.2 | 0.1 | 0.1 | 0.1 | 0.1 |
| PCE, excluding food and energy | 0.2 | 0.1 | 0.2 | 0.0 | 0.2 |
| Price indexes: | Percent change from month one year ago | ||||
| PCE | 2.3 | 2.3 | 2.3 | 2.2 | 2.0 |
| PCE, excluding food and energy | 2.0 | 2.0 | 2.0 | 2.0 | 2.0 |
[/su_table]
The increase in personal income in September primarily reflected gains in wages and salaries, government social benefits to persons, and rental income that was partially offset by a decline in proprietors’ income. However, while wages and salaries have been a strong component for the report in prior months, it was the weak component for September.
The $33.2 billion increase in real PCE in September reflects a gain of $33.5 billion in spending for goods and a $3.5 billion increase in spending for services. Within goods, motor vehicles and parts was the leading contributor to the increase, with solid contributions from recreational goods and vehicles.
For services, the largest contributor to the gain was spending for health care that was more than offset by a decrease in spending for food services and accommodations.
Personal outlays increased $57.9 billion in September. Personal saving was $975.7 billion in September, and the personal saving rate, personal saving as a percentage of disposable personal income, was 6.2%.
Estimates have been revised for July and August. Personal income held steady at a gain of 0.4%. Consumer spending rose slightly more (0.5%) than the initially reported 0.4%.
[su_table responsive=”yes”]
| Change from preceding month | ||||||||
|---|---|---|---|---|---|---|---|---|
| July | August | |||||||
| Previous | Revised | Previous | Revised | Previous | Revised | Previous | Revised | |
| (Billions of dollars) | (Percent) | (Billions of dollars) | (Percent) | |||||
| Personal income: | ||||||||
| Current dollars | 51.9 | 56.4 | 0.3 | 0.3 | 60.3 | 67.0 | 0.3 | 0.4 |
| Disposable Personal income: | ||||||||
| Current dollars | 45.5 | 46.0 | 0.3 | 0.3 | 51.4 | 55.4 | 0.3 | 0.4 |
| Chained (2012) dollars | 22.8 | 22.7 | 0.2 | 0.2 | 31.8 | 35.8 | 0.2 | 0.2 |
| Personal consumption expenditures: | ||||||||
| Current dollars | 62.7 | 65.3 | 0.4 | 0.5 | 46.4 | 64.9 | 0.3 | 0.5 |
| Chained (2012) dollars | 40.6 | 42.6 | 0.3 | 0.3 | 28.7 | 46.1 | 0.2 | 0.4 |
[/su_table]


