
Vulnerable incumbent Democrat Mark Pryor (left) and Republican Rep. Tom Cotton (right) are pictured in this composite image. (Photos: AP)
Republican Rep. Tom Cotton is now heavily favored to defeat incumbent Democratic Sen. Mark Pryor in the Arkansas Senate race this November, resulting in a much-needed net gain for the GOP. Recent data have increased Cotton’s chances of victory to 84 percent, up from 70 percent when we last visited the race, resulting in a strong Likely Republican rating and almost no chance that Pryor ends up holding on.
Let’s take a look at the commentary, analysis, polling, state data and, of course, you can always get an idea of the overall political landscape by checking out the 2014 Senate Map and generic ballot tabs on the end.
[tabs id=”ARSen” title=”Arkansas Senate Race – Cotton Vs. Pryor”] [tab title=”Commentary”]
The PPD model has always been more bullish on Rep. Tom Cotton in the Arkansas Senate race juxtaposed to other models, particularly the well-respected guys at Crystal Ball. We even previously disputed a decision they made to move the race to “Leans Democrat” some months back based on one PPP Poll before again moving it all the way to back to “Leans Republican” where it sits now.
We have always been pretty clear on our assessment, which is, even though Mark Pryor is a strong candidate and is certainly no Blanche Lincoln, it is more likely than not that he is going to lose. Now, both the public polling and PPD tracking data are converging with the “big picture” fundamentals.
Since mid-August, a single poll — CNN/Opinion Research — found him polling at 47 percent support. Pryor’s challenged by the reality he must run stronger than usual for a Democrat in the only swing region of the state remaining — the South — which means he must outperform in Arkansas’s 4th Congressional District, and you may have already guessed that it happens to be represented by Mr. Cotton. The district has continued to trend Republican, voting for Mitt Romney by a 26-point margin and currently has a PVI (Partisan Voting Index) of R+15.
In our analysis, we’ll talk more about the landscape in Arkansas county-by-county, and how each candidate is performing. The bottom line, Pryor isn’t just statistically challenged because of the estimated composition of the midterm electorate. With these numbers, even in an environment similar to presidential election level turnout, Pryor would still lose.
[/tab]
[tab title=”Analysis”]
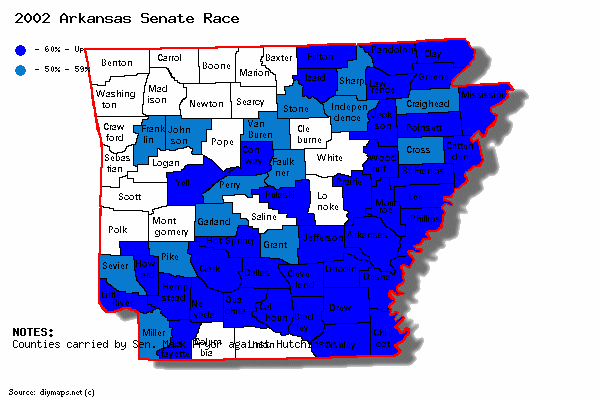
In order to put the data into context, let’s take a look at the 2002 Arkansas Senate race results by county, when Pryor defeated a then-severely damaged candidate, Tim Hutchinson, 53.90 to 46.10 percent.

This was a particularly strong performance for Pryor considering 2002 was a fairly good Republican year. But if we look at the counties Pryor carried with 60 percent or more of the vote (dark blue) and 50 – 59 percent (light blue), then 1) the past performance is even more impressive, and 2) we will have a more in-depth understanding of Pryor’s current challenges. Forgive the rendition of the map, but you’ll get the point.

Pryor was able to hold down Hutchinson’s margins in the reliably Republican regions, including in the Northwest, save for Benton. He won Pulaski County handily, which is where Little Rock is located, but also did well in its suburbs. Obviously, he carried the Delta counties by overwhelming margins, largely because it is one of the few regions of the state with a substantial black voter presence.
But, even with all of that aside, Pryor’s relatively narrow win came from his performance in southern Arkansas. This is where Pryor’s father comes into consideration. He represented the area in Congress, and Pryor carried almost all of these counties.
It is fair to call southern Arkansas a borderline swing region of the state. Prior Democrats who went down in defeat were very close to mirroring Pryor’s performance in the Delta and in Pulaski County. However, because they were not as strong in the southern region of the state, they lost. In 2000, Al Gore split these counties with George Bush, and lost the state by five points. In 2004, John Kerry lost nearly all of them. Demonstrating Pryor’s strength, Kerry and Gore didn’t come anywhere near the 70 percent level of support that Pryor enjoyed, even in the Democrat-friendly counties they won.
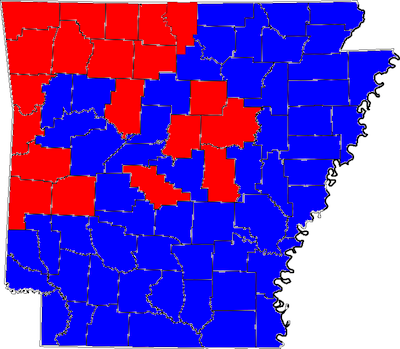
While Democrats typically perform well in the Delta, Little Rock and southern Arkansas, all of these counties combined cannot deliver a Democratic victory without duplicating or coming close to duplicating Pryor’s 2002 performance in the “southern swing” region. Why is this unlikely? Well, a large part of the region falls within Arkansas’s 4th Congressional District, which again, is Cotton country. Take a look at the map below, and zoom in a few clicks if necessary.
Notice the overlap? As of now, Cotton leads Pryor in both recent polling and PPD tracking in the 4th Congressional District by an average 48.5 – 40.5 percent. In fact, unsurprisingly, Pryor holds a smaller 5.5 percent lead in only one district, the Democratic-leaning 2nd Congressional District. Meanwhile, Cotton holds commanding leads in the 1st and 3rd Congressional Districts.
The bottom line is that Mr. Pryor simply does not have enough votes to avoid defeat. Even if we were to assume a more favorable Democratic electorate — say the 2012 election cycle — Pryor would actually lose support, and would still trail by a healthy 8-point margin.
Of course, in politics anything can happen in two weeks. But, realistically, no one anticipates it will. It would have to be a truly earth-shattering event to change voters’ minds to the tune of 10-points at this point. I hesitate to ever call a race safe, but the GOP can count this one as a net pickup.
[/tab]
[tab title=”Polls”]
| Poll | Date | Sample | MoE | Cotton (R) | Pryor (D) | Raw Spread | PPD Spread |
|---|---|---|---|---|---|---|---|
| PPD Average | 8/18 – 10/16 | — | — | 47.3 | 41.2 | Cotton +6.1 | Cotton +8 |
| Talk Business Poll* | 10/15 – 10/16 | 2075 LV | 2.2 | 49 | 40.5 | Cotton +9.5 | |
| Rasmussen Reports | 10/13 – 10/15 | 940 LV | 4 | 47 | 44 | Cotton +3 | |
| FOX News* | 10/4 – 10/7 | 707 LV | 3.5 | 46 | 39 | Cotton +7 | |
| CBS News/NYT/YouGov | 9/20 – 10/1 | 1991 LV | 2 | 45 | 41 | Cotton +4 | |
| Rasmussen Reports | 9/24 – 9/25 | 750 LV | 4 | 47 | 40 | Cotton +7 | |
| USA Today/Suffolk* | 9/20 – 9/23 | 500 LV | 4.4 | 43 | 44.8 | Pryor +1.8 | |
| Public Policy Polling (D) | 9/18 – 9/21 | 1453 LV | 2.6 | 45 | 39 | Cotton +6 | |
| Gravis Marketing | 9/8 – 9/11 | 902 LV | 4 | 47 | 43 | Cotton +5 | |
| NBC News/Marist* | 9/2 – 9/4 | 639 LV | 3.9 | 45 | 40 | Cotton +5 | |
| CNN/Opinion Research | 8/28 – 9/2 | 523 LV | 4.5 | 49 | 47 | Cotton +2 | |
| CBS News/NYT/YouGov | 8/18 – 9/2 | 1572 LV | 3.0 | 43 | 39 | Cotton +4 |
(Please note: Our model uses separately calculated averages from weighted polls based on PPD’s Pollster Scorecard. Above is the raw spread and average.)[/tab]
[tab title=”State Data”]
POLITICS |
Arkansas | National Average |
Partisanship |
||
| % Republican/Lean Republican | 39 | 39 |
| % Democratic/Lean Democratic | 41 | 43 |
| Registered Republicans | N/A | — |
| Registered Democrats | N/A | — |
| Unaffiliated/Undeclared | N/A | — |
Ideology |
||
| % Conservative | 41 | 36 |
| % Moderate | 35 | 36 |
| % Liberal | 17 | 23 |
Presidential Job Approval |
||
| % Approve | 32.5 | 40.6 |
Partisan Voting Index |
||
| Strongly Republican | R+14 | — |
[/tab]
[tab title=”2014 Senate Map”]
[show-map id=’1′]
LEGEND: SAFE DEM | LIKELY DEM | LEANS DEM | TOSS-UP | LEANS GOP | LIKELY GOP | SAFE GOP
[/tab]
[tab title=”Generic Ballot”]
[table id=3 /]
[/tab]
[/tabs]


