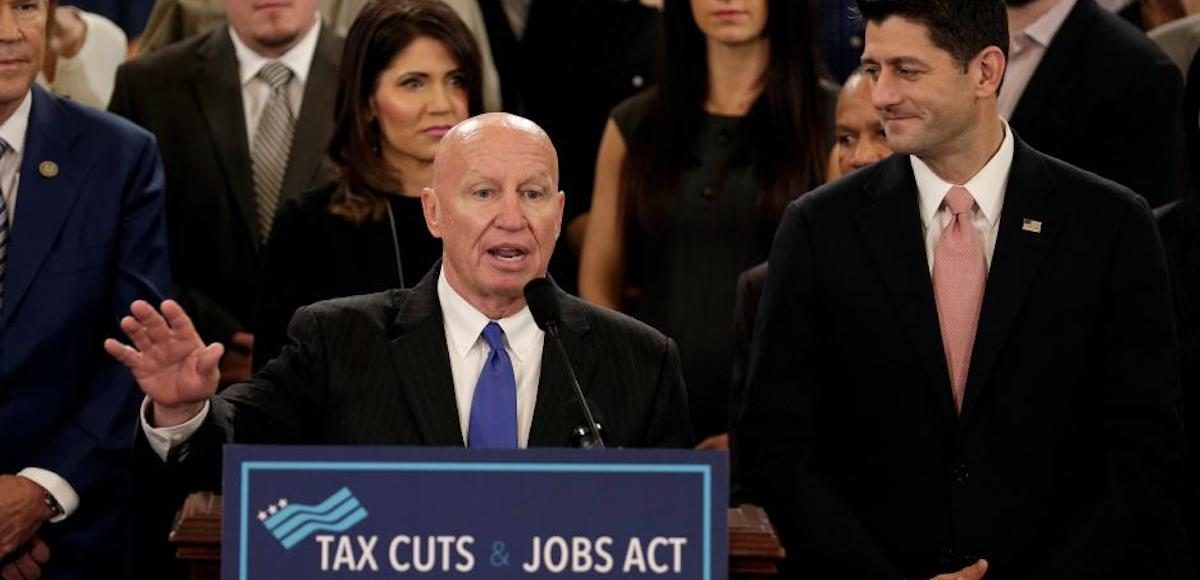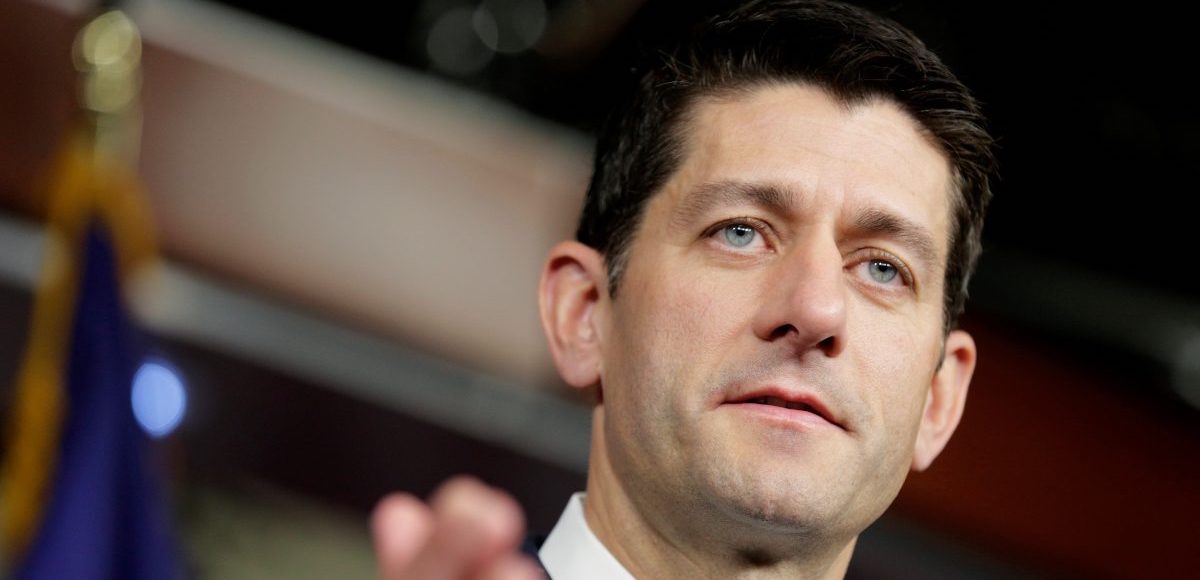

House Speaker Paul Ryan, Ro-Wis., speaks about tax reform on Capitol Hill in Washington, D.C. (Photo: Reuters)
On Tuesday, a special election in Ohio’s 12th Congressional District is being held to replace Republican incumbent Patrick Tiberi. On October 19, 2017, Rep. Tiberi announced that he would leave Congress before January 31, 2018, to lead the Ohio Business Roundtable.
The National Republican Congressional Committee (NRCC) and Republican National Committee (RNC) have decided to make tax reform the center of their midterm pitch to voters. The RNC and the president’s campaign recently transferred $8 million to the NRCC to make that pitch.
Demographically speaking, Ohio 12 is an ideal district and the special election is an ideal time to test the Republican’s tax reform pitch to voters before the 2018 midterm elections.
In 2016, President Donald Trump crushed Hillary Clinton in the historically razor-thin battleground Buckeye State, 51.69% to 43.56%. That compares to the 2.98-point loss Mitt Romney suffered against Barack Obama in 2012, and the 4.19-point loss John McCain suffered in 2008.
However, in Ohio 12, each party’s share of the vote and the overall margin didn’t differ much at all from either 2012 or 2008.
In 2016, Mr. Trump carried Ohio 12 with 53.2% of the vote, compared to 41.9% for Mrs. Clinton. Mr. Romney garnered 54.4% of the vote in 2012 and Mr. McCain, 53.7%. Mr. Obama got 43.9% in 2012, down just a hair from the 44.8% he got districtwide in 2008.
The district is demographically geared more towards the traditional GOP coalition, not the Trump coalition. In 2016, Rep. Tiberi won reelection with 66.6% of the vote. In 2014, he won 68.1% of the vote. In 2012, he won 63.5% juxtaposed to Mr. Romney’s 54.4%.
The demographics get even better for those of us studying the impact of tax reform on voters.
The district is also a higher-income bracket than the media’s favorite portrayal of the average Trump voter. The median household income is $61,304, the high school graduation rate is 92.4% and the college graduation rate is 37%.
The Tax Foundation pegs average income in the district among those earning from $50,000 to $75,000 at $61,421. These workers got an average tax cut of $1,456 due to the Tax Cuts and Jobs Act (TCJA). Those making from $75,000 to $100,000 enjoyed an average tax cut of $1,936 due to the TCJA.
Consider the graphic below, courtesy of the Tax Foundation.
It’s clear. Working voters in this congressional district have benefited from the TCJA. Yet, according to a recent Emerson College Poll, 45% of voters in the district support the tax reform law, while 41% are opposed and 11% are undecided.
The poll, which was notably taken prior to the president’s rally in the district on August 4, found Democrat and Franklin County Recorder Danny O’Connor leading by just 1 point with 47% of the very likely vote. State Senator Troy Balderson was at 46%, and 7% of very likely voters were undecided.
Worth noting, as I tweeted, depending on which public or private internal poll, Rick Saccone was down by 4 to 8 points against Connor Lamb the weekend before the special election in Pennsylvania’s 18th Congressional District.
The president’s visit erased that deficit over that last weekend. While Mr. Saccone lost that race. He barely lost it. We have found the president’s rallies increase GOP voter enthusiasm.
I, as well as some others at Big Data Poll and elsewhere, have argued that tax policy has little impact on base enthusiasm juxtaposed to other issues. Republican base voters vote on what we call “liberty issues,” like immigration and health care.
While it certainly can’t hurt, the data indicate tax reform — even when billed as “cuts” instead of reform — should be part of a bigger economic message, and even secondary to one of the more voter-exciting liberty issues.
Further, Republican congressional candidates are fighting a lack of enthusiasm stemming from the party’s resistance to the president’ agenda, an agenda that won them such a historic election. Mr. Balderson isn’t holding President Trump’s coalition as solidly as Mr. O’Connor is holding Mrs. Clinton’s coalition.
The poll found voters who hacked Mrs. Clinton are breaking for Mr. O’Connor 95% to 3%, while those who backed President Trump are breaking for Mr. Balderson by a lesser margin, 89% to 7%.
That’s not from President Trump weighing down the party’s candidate. It’s quite the opposite.
Nevertheless, Buckeyes making between $100,000 to $199,999 backed President Trump over Mrs. Clinton by a 57% to 39% margin. These voters, with an average income of $132,146, got an average tax cut of $2,762.
If the Republican Party is bleeding voters from this demographic group, as so many have suggested, then tax reform doesn’t make a lot of sense as a cause. We will be watching this group, as well as non-college educated voters.
If Republicans are performing poorly in historically Republican districts like this, then it’s far more likely due to a growing disconnect between what Republican leaders think voters want them to focus on, and what voters actually tell us they want them to focus on.
UPDATE: Worth adding, GOP enthusiasm was roughly on par with Democrat enthusiasm until the failure to repeal ObamaCare. On the flip side, Democrat enthusiasm has been relatively flat.
Just looking at our data, one of the fundamentals Democrats have on their side is consistent enthusiasm. They mirror GOP in 2014 & 2016. High & relatively flat. Around 70-80 percent, with minimal spikes and dips. GOP enthusiasm bobs up and down, as low as in the 60s. But spikes.
— Richard Baris (@Peoples_Pundit) August 5, 2018


