
Three days into a new month, stocks remain on the same trajectory as January as investors continue to respond positively to strong earnings and a steadily improving economy.
After posting high single digit gains during the first month of the year, the Dow Jones Industrial Average (^DJI), S&P 500 (^SPX) and NASDAQ Composite (^IXIC) have tacked on additional gains ranging from +1.25% to +1.6% during the first 3 days of February.
This has set the stage for the S&P 500 and NASDAQ to mount a serious assault on their 200 day moving averages (MAs).
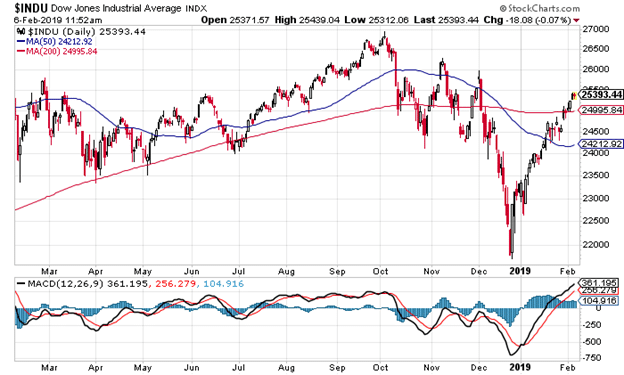
While the DJIA, at 25,411, has closed above its 200 day MA of 24,996 for 3 consecutive days, the other 2 Major Averages have not closed above their respective 200 day MAs for at least 2 months.
They say that a picture paints a thousand words, Let’s take a look at a few charts.

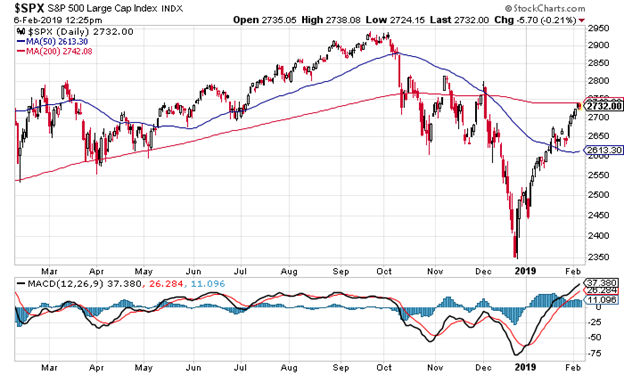
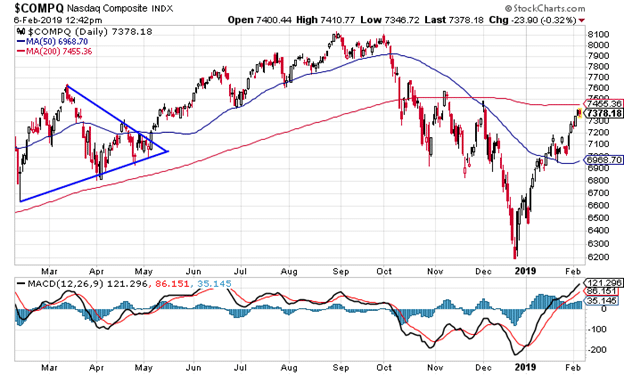
Note that the 200 day MA for the DJIA, at 24,995.84 is almost exactly where it was in mid October when the market began to decline. You will also see a similar pattern for the 200 day MA on the S&P 500 and NASDAQ charts. This sharp plunge in the last 2 weeks of December created the dynamic of “flatlining” the 200 day MA, as a solid month of daily closing prices were well below the moving average line.
The DJIA at 25,400 is close to 1.5% above its 200 day MA. While one sharp daily decline could wipe that out, technical support of the 200 day MA is almost exactly at the Big Round Number of 25,000, which could add some psychological support on a pull back that tests the technical support of the 200 day MA.

The S&P 500 at 2738 (Tuesday’s close), is less than 5 points from its 200 day MA of 2742. The last close above its 200 day was December 3, and that’s only happened 4 days since mid October.
Clearly we’ve had a big move from wildly over sold in late December to moderately extended, as highlighted by the oscillators below the chart. That being said, we’ve had both technical (extremely oversold) and fundamental (the FED, Earnings, Macro Data) support for the move higher.
Should the S&P 500 get through the 200 day moving average, the 2800 level would be the next major hurdle.

The NASDAQ composite at 7402 (Tuesday’s close) Is also well within reach of its 200 day moving average of 7455. With its high concentration of tech and internet names, it naturally trades with a higher volatility than the S&P 500. The NASDAQ hasn’t closed above its 200 day since November 8, one of only 2 days it has been above that benchmark since mid October.
Expect resistance at the 200 day, but with Q4 earnings in the rear view mirror, and the barrage of negative headlines on the Social Media/FANG names, possibly taking a breather, trading north of the 200 day might be an easier lift than anticipated.
Stay tuned.


