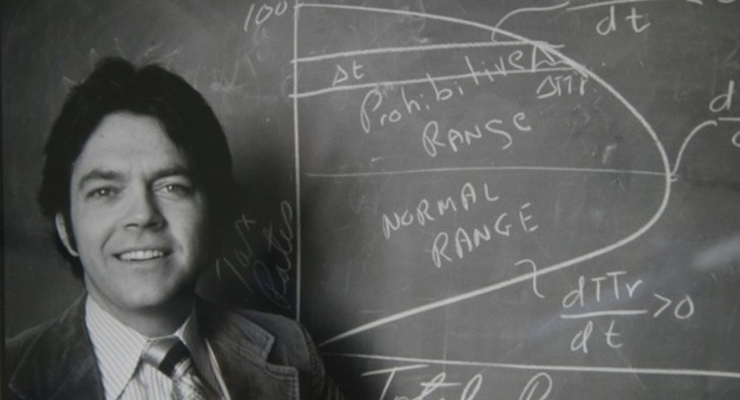

Art Laffer, former economic advisor to President Ronald Reagan and the architect of the Laffer Curve.
The welfare state is bad news. It’s bad for taxpayers and it’s bad for recipients. It’s also bad for the economy since prosperity is in part a function of the quantity of labor that is productively employed. As such, government programs that lure people into dependency obviously reduce national economic output.
We can get a sense of how the nation is being hurt by reviewing some of the scholarly literature.
Writing for the Cato Journal, Lowell Gallaway and Daniel Garrett explore the relationship between redistribution spending and poverty reduction.
They start by pointing out that more welfare spending used to be associated with reductions in poverty. But when President Johnson launched his so-called War on Poverty and dramatically increased the level of redistribution, the link between welfare spending and poverty reduction substantially weakened.
…the real per capita cost in the United States of federal public aid rose 70 percent in the 11 years between 1953—the first year the federal government reported an official poverty rate—and Johnson’s 1964 remarks. In the 11 years that followed, however, that same real per capita cost increased by an astonishing 434 percent—that is, more than six times faster than in 1953–64. …in 1953–64, every 10 percentage point increase in public aid was associated with a 1 percentage point drop in the official poverty rate. Compare that with the experience of the 11 years following the outbreak of hostilities in the War on Poverty. During that interval, every 1 percentage point fall in the poverty rate was accompanied by a 50 percentage point increase in real public aid. …the relationship between public aid and the poverty rate is subject to the principle of diminishing returns.
Not just a diminishing return. There’s a point at which more redistribution actually leads to an increase in poverty.
Just like there’s a point at which higher tax rates lead to less revenue. And the authors recognize this link.
This is a Laffer Curve type relationship, which is to say that while public aid initially decreases poverty, there eventually comes a point at which additional increases in public aid increase poverty. …the effectiveness of additional real public aid expenditures, as a policy instrument designed to reduce the poverty rate, had been exhausted by the mid-1970s. Indeed, any additional public aid beyond the mid-1970s levels would result in an increase, not a decrease, in the poverty rate.
Gallaway and Garrett crunch the numbers.
…to calculate the impact of public aid expenditures on the incidence of poverty in the United States. The greatest poverty-reducing effect occurs at $1,291 of per capita expenditures on public aid, which produces a 6.07 percentage point reduction in the overall poverty rate. However, as the level of real per capita public aid rises beyond $1,291, the poverty reducing effect is eroded. …at $2,407 of per capita public aid, all of the initial reductions in the poverty rate have disappeared. …By 2010, real per capita aid stood at $2,697—a level that produces a 2.52 percentage point increase in the poverty rate. Thus, the impact of per capita public aid in 2010 being $1,406 greater than the optimal, poverty-reducing level was to increase the poverty rate by 8.59 percentage points, according to our analysis.
Here’s the relevant table from their article.
Unfortunately, they didn’t create a hypothetical curve to show these numbers, so we don’t have the welfare/poverty version of the Laffer Curve.
But they do estimate the negative human impact of excessive redistribution spending.
Since the official poverty rate in 2010 was 15.1 percent, this implies that in the absence of that extra $1,406 of per capita public aid, the official poverty rate in 2010 would have been 6.5 percent. …Taking dynamic factors into consideration would probably lower the figure to less than 6 percent. This implies that the actual poverty rate in 2010 was more than two and-one-half times higher than it could have been were it not for the excessive use of public aid income transfers as an instrument of policy. In other words, it may be argued that public aid overreach was responsible for approximately 30 million extra people living in poverty in 2010.
And children are among the biggest victims.
…one in every eight American children is living below the poverty line because public aid payments exceed the level that would minimize the poverty rate.
Ugh, this is terrible news. Children raised in government-dependent households are significantly more likely to suffer adverse life outcomes, in large part because of very poor social capital.
Last but not least, the authors also speculate that excessive redistribution may be one of the reasons why the distribution of income has shifted.
…up to the mid- 1970s, government cash income transfers (public aid) were increasing the incomes of those in the bottom quintile of the income distribution by more than work-disincentive effects were reducing them. The result was a reduction in the official poverty rate. …However, as the volume of public aid payments continued to increase, the work-disincentive effect more than offset the income enhancements generated by the flow of public aid. As this happened, the poverty rate began to drift upward and the percentage share of all income received by those in the bottom quintile of the income distribution began what would turn out to be a long and steady decline.
By the way, I don’t think that there’s a “correct” or “proper” level of income distribution. That should be a function of what people contribute to economic output. I’m concerned instead with boosting growth so everyone has a chance to rise.
Which is why it is especially tragic that redistribution spending is trapping less-fortunate people in long-term government dependency by undermining their incentives to earn income.
The bottom line is that it’s time to reduce – and ideally eliminate – the Washington welfare state. Though that involves a major challenge since the real beneficiaries of the current system are the “poverty pimps” in Washington.


