
A doctor puts his hand over his chest during a “House call” rally against proposed healthcare reform legislation at the Capitol in Washington November 5, 2009. (Photo: Reuters)
A new study finds all but 1 the best 10 states for doctors to practice medicine in are Republican states, while all of the 10 worst states are Democratic states. WalletHub compared all 50 states and the District of Columbia across 16 key metrics in order to help doctors decide where to practice, and the results are noteworthy.
Not a single Republican voted for ObamaCare and most Republican states opted out of the Medicaid expansion provision in the signature Democratic legislation. With young doctors coming out of medical school with an average student loan debt of more than $190,000 in 2017, the bill has asked them to provide their skills and services for a reduced cost.
First, let’s take a look at the entire table.
| Overall Rank (1=Best) |
State | Total Score | ‘Opportunity & Competition’ Rank | ‘Medical Environment’ Rank |
|---|---|---|---|---|
| 1 | South Dakota | 75.97 | 3 | 1 |
| 2 | Nebraska | 70.66 | 7 | 3 |
| 3 | Idaho | 70.64 | 1 | 17 |
| 4 | Iowa | 70.16 | 2 | 16 |
| 5 | Minnesota | 69.94 | 9 | 4 |
| 6 | Wisconsin | 69.84 | 6 | 7 |
| 7 | Kansas | 68.86 | 8 | 9 |
| 8 | Montana | 68.01 | 5 | 13 |
| 9 | North Dakota | 65.19 | 14 | 11 |
| 10 | Wyoming | 64.88 | 4 | 35 |
| 11 | Alabama | 62.50 | 11 | 31 |
| 12 | Mississippi | 62.24 | 10 | 43 |
| 13 | Arizona | 62.10 | 12 | 32 |
| 14 | Colorado | 61.95 | 18 | 12 |
| 15 | Tennessee | 61.77 | 16 | 24 |
| 16 | Utah | 60.92 | 17 | 20 |
| 17 | Maine | 60.70 | 32 | 2 |
| 18 | South Carolina | 60.25 | 19 | 21 |
| 19 | Washington | 58.59 | 20 | 26 |
| 20 | Georgia | 58.31 | 22 | 22 |
| 21 | West Virginia | 58.24 | 13 | 45 |
| 22 | Nevada | 57.40 | 15 | 47 |
| 23 | Arkansas | 56.99 | 25 | 25 |
| 24 | North Carolina | 56.86 | 35 | 8 |
| 25 | Indiana | 56.82 | 27 | 23 |
| 26 | Alaska | 56.37 | 39 | 5 |
| 27 | Louisiana | 56.11 | 21 | 37 |
| 28 | Texas | 55.55 | 33 | 14 |
| 29 | New Mexico | 54.16 | 24 | 40 |
| 30 | Florida | 54.08 | 29 | 34 |
| 31 | Missouri | 53.90 | 26 | 38 |
| 32 | Pennsylvania | 53.25 | 31 | 36 |
| 33 | Kentucky | 53.07 | 23 | 46 |
| 34 | Vermont | 52.93 | 42 | 6 |
| 35 | Michigan | 52.83 | 36 | 27 |
| 36 | Oklahoma | 52.53 | 34 | 28 |
| 37 | New Hampshire | 52.32 | 28 | 44 |
| 38 | Virginia | 51.05 | 40 | 29 |
| 39 | Delaware | 49.03 | 37 | 39 |
| 40 | Ohio | 48.99 | 38 | 42 |
| 41 | Connecticut | 48.94 | 44 | 15 |
| 42 | Illinois | 48.86 | 30 | 51 |
| 43 | California | 47.82 | 46 | 18 |
| 44 | Maryland | 47.82 | 41 | 41 |
| 45 | Oregon | 47.71 | 47 | 19 |
| 46 | Massachusetts | 46.59 | 43 | 33 |
| 47 | District of Columbia | 45.75 | 51 | 10 |
| 48 | Hawaii | 43.25 | 50 | 30 |
| 49 | New York | 41.39 | 49 | 48 |
| 50 | Rhode Island | 40.86 | 45 | 50 |
| 51 | New Jersey | 40.24 | 48 | 49 |
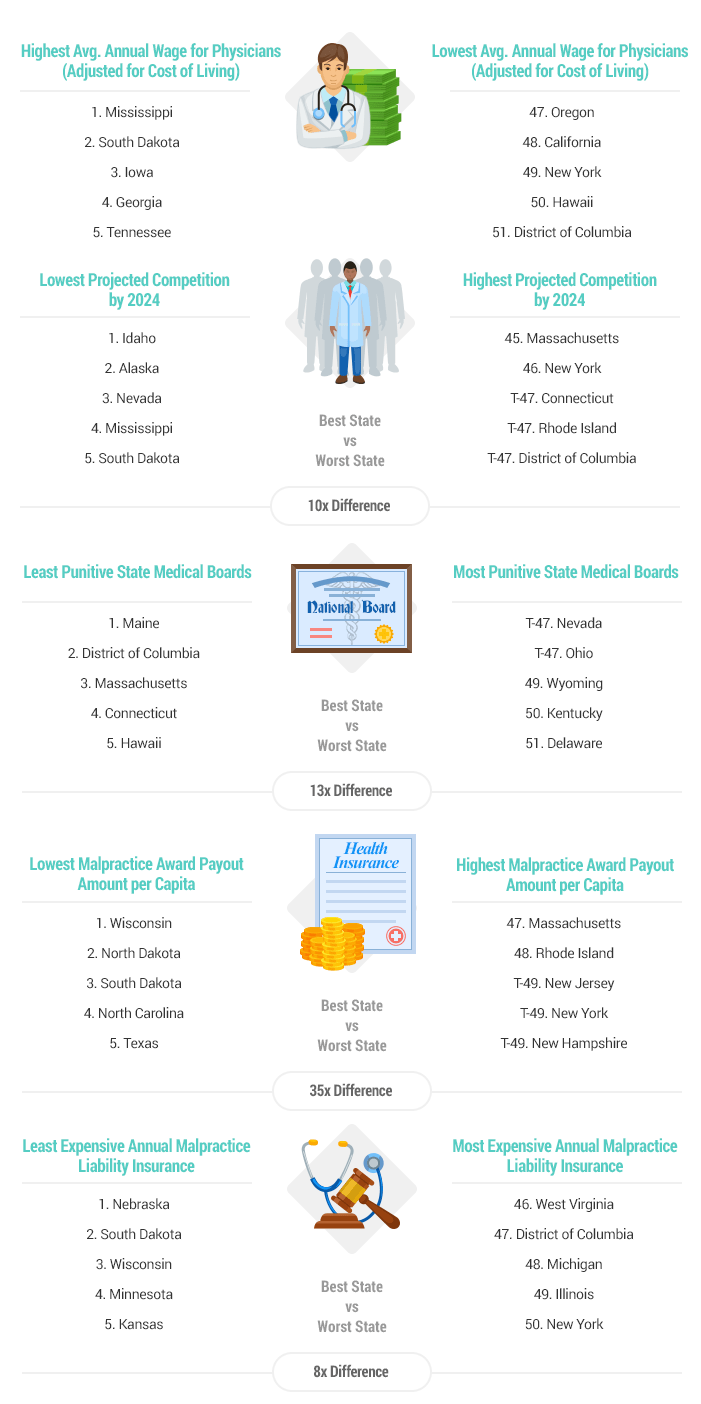
One of the major complaints regarding ObamaCare was that it would increase competition among consumers, not providers. According to WalletHub, the best 5 states for projected competition by 2024 include 4 red states and 1 purple state (Nevada), while the worst 5 are all blue states.
The best 5 states for the highest annual wages (adjusted for cost of living) are all red states, while the bottom 5 worst are all blue states. It’s worth noting that doctors’ wages in the most extreme leftwing states for healthcare are the worst, while those in extreme red states have it the best.
| Highest Average Annual Wage | Lowest Average Annual Wage |
| Mississippi | Oregon |
| South Dakota | California |
| Iowa | New York |
| Georgia | Hawaii |
| Tennessee | District of Columbia |
* Adjusted for cost of living
In other words, doctors are being forced to compete over more for less money, otherwise known in the free market as profit inventive. There is a 10-time difference between the 5 best and worst states on these two metrics.
We’ll leave you with their infographic below.

Source: WalletHub


