Widget Image
Follow PPD Social Media
Sunday, January 12, 2025
HomeStandard Blog Whole Post (Page 112)

Hagedorn Squeezed Blood from a Stone in Red Counties, Swing Counties Pivoted Back

While the results of the Wisconsin Supreme Court election are unofficial, Judge Brian Hagedorn leads Judge Lisa Neubauer 50.2% to 49.8% with 100% reporting. It was an unexpected nail-biter that remained too close to call in the early hours Wednesday morning.

In the Badger State, seven justices are selected in nonpartisan elections for 10-year terms on the state’s high court. But in reality, each ideology is well-known and judicial elections become party causes.

Liberal Judge Neubauer was expected to win. Private polling on the Republican side showed Judge Hagedorn trailing in the mid-to-high single digits, while Democratic internal polling showed him trailing by double-digits.

At this point, Judge Neubauer has the option to petition for a recount at her own expense. But barring significant developments or tabulation errors, Judge Hagedorn is the apparent victor.

CandidatePercentVotes
Brian Hagedorn (Nonpartisan)  50.2%605,728
Lisa Neubauer (Nonpartisan)  49.8%599,766

3638 of 3638 (100%) Precincts Reporting, 1,205,494 Total Votes

(Note: Ashland County was reversed on the map and has been updated.)

We will not call this race until the results are certified. But if and when they are and the nearly 6,000-vote margin holds, it’ll give conservatives a majority on the state’s highest court until 2023.

So, how did conservatives defy the polls and the odds in Wisconsin? The answer should concern Democrats as we head into the 2020 presidential election cycle.

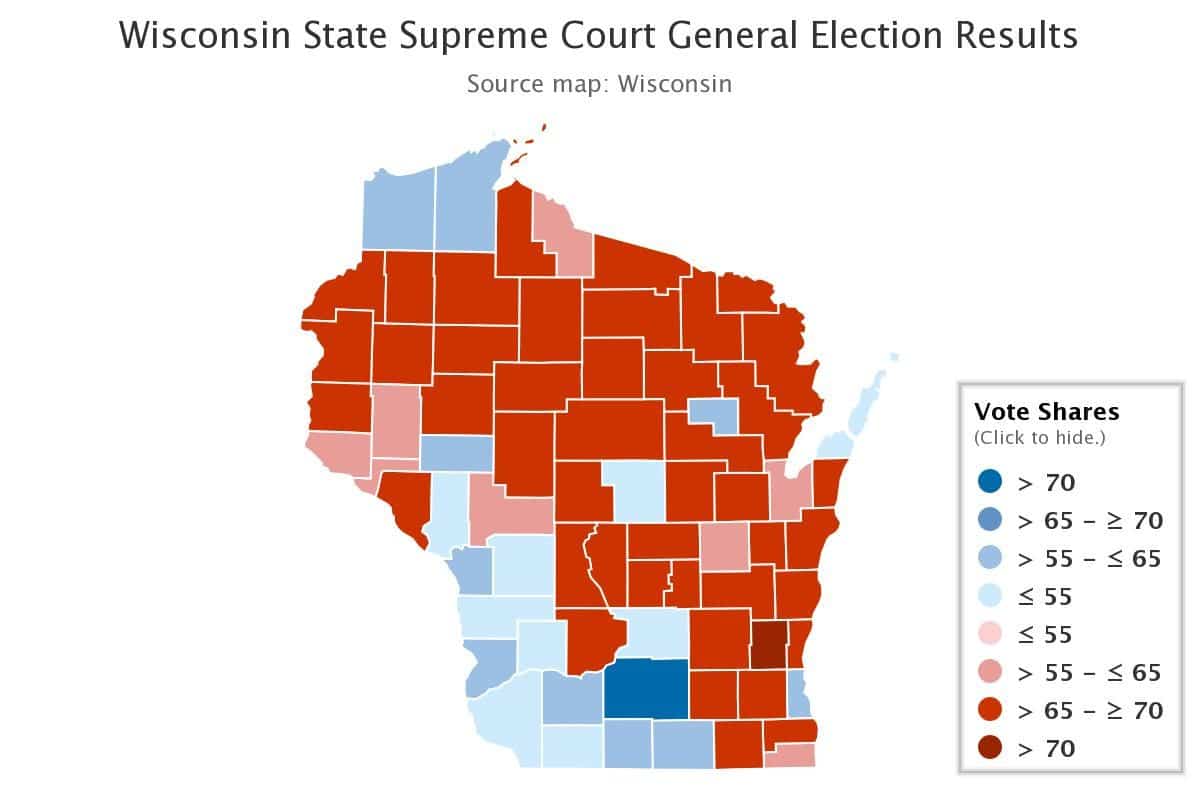
First, Judge Hagedorn improved significantly over Michael Screnock’s vote shares in 2018 in all of the BOW-WOW, including the swing counties of Brown (52.93% to 47.07%), Outagamie (55.47% to 44.53%) and Winnebago (51.70% to 48.30%),

We saw a continued increase in vote share in red Waukesha (68.54% to 31.46%), Ozaukee (62.70% to 37.30%), and Washington (74.83% to 25.17%). He also carried the swing counties of Buffalo (55.55% to 44.45%), Racine (56.90% to 43.10%) and Kenosha (51.37% 48.43%).

Overall, Judge Hagedorn carried 50 of the state’s 72 counties.

Meanwhile, Judge Neubauer improved over Hillary Clinton’s support in Western Wisconsin, but the Milwaukee suburbs that swung against the GOP in 2018, swung back.

President Donald Trump did better in Western Wisconsin, unsurprising given his conservative populist message. But my argument all along has been that those suburban voters who swept out the Republican House in 2018, are not “Democrats.”

They are “swing” or “pivot” voters, and they pivoted back. That is what they do, hence the name.

Recount History in Wisconsin

The last time a Wisconsin Supreme Court election was petitioned for a recount was in 2011. Assistant Attorney General JoAnne Kloppenburg challenged sitting Justice David Prosser.

The day after the April 5 election, Kloppenburg, was leading and declared victory. But a clerical error in Waukesha County resulted in thousands of ballots being left out of the county’s initial count.

Following the correction, Prosser gained a lead over Kloppenburg. On April 15, 2011, the Government Accountability Board certified Prosser as the winner of the election with a vote margin of 7,136 votes.

On April 20, Kloppenburg filed a request for a recount because Prosser’s 0.488% margin of victory was below the 0.5% threshold required for recounts at the time. On May 23, the Government Accountability Board completed the recount and certified Prosser as the winner.

The final count found Prosser leading Kloppenburg by 7,004 votes, a 0.46% margin of victory.

That said, the Wisconsin Election Commission has weighed in, admitting there were very few problems. Given the lack of error, the margin is unlikely to be overturned.

The closeness of the race does not explain why we haven’t yet called the election. We are waiting on the unofficial results to be certified. Judge Hagedorn has declared victory and our lack of call shouldn’t be construed to mean that decision was particularly premature.

You Might Also Like

While the results of the Wisconsin Supreme
A Walmart employee who serves as a "customer host," walks in front of the customer service desk at a Walmart super-center location in Gainesville, Florida. (Photo: Laura Baris/People's Pundit Daily/PPD)
A Walmart employee who serves as a “customer host,” walks in front of the customer service desk at a Walmart super-center location in Gainesville, Florida. (Photo: Laura Baris/People’s Pundit Daily/PPD)

The Institute for Supply Management (ISM) service sector manufacturing index (NMI) moderated in March to a still solid 56.1%. According to the NMI, 16 non-manufacturing industries reported growth.

The consensus forecast was 58.0, ranging from a low of 56.5 to a high of 59.5.

“The non-manufacturing sector’s growth cooled off in March after strong growth in February,” said Timothy R. Fiore, ISM Manufacturing Business Survey Committee. “Respondents remain mostly optimistic about overall business conditions and the economy.”

“They still have underlying concerns about employment resources and capacity constraints.”

The NMI Business Activity Index fell 7.3% from 64.7% to 57.4%, reflecting growth for the 116th consecutive month, albeit at a slower rate. The New Orders Index came in at 59%, a decline of 6.2% from the reading of 65.2% in February.

The Employment Index rose marginally by 0.7% in March to 55.9% from the February reading of 55.2%. The Prices Index increased 4.3 percentage points from the February reading of 54.4% to 58.7%, indicating that prices increased in March for the twenty-second consecutive month.

Survey Responses

  • “Labor is tight and in short supply.” (Accommodation & Food Services)
  • “While we have a slowed down in residential service and install [area], we are still experiencing strength in the new commercial construction area.” (Construction)
  • “Q1 revenue in total on plan or slightly above. Some products slightly below plan. Overall, good start to 2019.” (Finance & Insurance)
  • “Supply expenses are up commensurately with business conditions as business activity has outpaced the budget on average four to six percent for our fiscal cycle that [began] 7/1/18.” (Health Care & Social Assistance)
  • “There is a sense of relief in our industry with the temporary reprieve of the additional tariffs. As of now, we feel this will help us maintain competitive prices and steady margins over the next quarter.” (Management of Companies & Support Services)
  • “Activity level held flat.” (Mining)
  • “Initial surge in business at the beginning of the year has peaked and settled to a more stable level.” (Professional, Scientific & Technical Services)
  • “Locally as construction grows, a shortage of available workers for the industry is occurring for future projects.” (Public Administration)
  • “April is when our real busy season begins and it has arrived early this year, demand is quite strong.” (Real Estate, Rental & Leasing)
  • “Labor, weather and regulatory issues have impacted operations.” (Transportation & Warehousing)

The Institute for Supply Management (ISM) service

Goods-Producing Sector Loses 6K; February Revised Up from 183K to 197K

Man reading newspaper with the headline Job Market. (Photo: AdobeStock)

The ADP National Employment Report finds the U.S. private sector added 127,000 jobs in March, missing the forecast. The goods-producing sector was weak, while services added 135,000.

“March posted the slowest employment increase in 18 months,” said Ahu Yildirmaz, vice president and co-head of the ADP Research Institute.  “Although some service sectors showed continued strength, we saw weakness in the goods producing sector.”

The consensus forecast was 165,000, ranging from of a low 150,000 to a high of 184,000. The total of jobs added in February was revised up from 183,000 to 197,000. It’s the second straight month of significantly upward revisions.

“The job market is weakening, with employment gains slowing significantly across most industries and company sizes,” Mark Zandi, chief economist of Moody’s Analytics, said. “Businesses are hiring cautiously as the economy is struggling with fading fiscal stimulus, the trade uncertainty, and the lagged impact of Fed tightening.”

“If employment growth weakens much further, unemployment will begin to rise.”

Small businesses with 1 to 49 employees added 6,000 jobs; medium businesses with 50-499 employees added 63,000 jobs; and, large businesses with 500 or more employees added 60,000.

You Might Also Like

The ADP National Employment Report finds the

Hagedorn Leads in Stunning Upset Over Neubauer By 5,962 Votes

Voting, elections and state polls concept: Ballot box with state flag in the background - Wisconsin. (Photo: AdobeStock)
Voting, elections and state polls concept: Ballot box with state flag in the background – Wisconsin. (Photo: AdobeStock)

The Wisconsin Supreme Court election on Tuesday unexpectedly turned into a a nail-biter, remaining too close to call in the early hours Wednesday morning. In the Badger State, seven justices are selected in nonpartisan elections for 10-year terms on the state’s high court.

Please note: This article will be updated to reflect the latest results.

With 99% of precincts reporting, Brian Hagedorn leads Lisa Neubauer 50.2% to 49.8%, or by roughly 5,500 votes. While the elections are technically nonpartisan, Judge Hagedorn is the conservative, while Judge Neubauer is the liberal.

CandidatePercentVotes
Brian Hagedorn (Nonpartisan)  50.2%605,728
Lisa Neubauer (Nonpartisan)  49.8%599,766

3638 of 3638 (100%) Precincts Reporting, 1,205,494 Total Votes

Turnout eclipsed the 2018 election, with more than 1.2 million votes being cast. The largest vote share remained in Outagamie County, where Judge Hagedorn currently leads by roughly 54% to 45%.

UPDATE: The remaining 5 precincts in Outagamie County have reported, expanding Judge Hagedorn’s lead.

In 2016, Donald Trump carried Outagamie County with 54.2% of the vote.

Regardless, Judge Neubauer has put out a press release more than insinuating she will petition for a recount. Wisconsin state law now allows the apparent loser to petition election officials for a recount if:

  1. the candidate lost by no more than 40 votes if 4,000 votes or fewer were cast
  2. the candidate lost by no more than one percent of the total votes cast if more than 4,000 votes were cast


A recount petition must be filed with the clerk or agency that received nomination papers for the office for which the recount is being requested.

Meanwhile, Judge Hagedorn has declared victory.

Recount History in Wisconsin

The last time a Wisconsin Supreme Court election was petitioned for a recount was in 2011. Assistant Attorney General JoAnne Kloppenburg challenged sitting Justice David Prosser.

The day after the April 5 election, Kloppenburg, was leading and declared victory. But a clerical error in Waukesha County resulted in thousands of ballots being left out of the county’s initial count.

Following the correction, Prosser gained a lead over Kloppenburg. On April 15, 2011, the Government Accountability Board certified Prosser as the winner of the election with a vote margin of 7,136 votes.

On April 20, Kloppenburg filed a request for a recount because Prosser’s 0.488% margin of victory was below the 0.5% threshold required for recounts at the time. On May 23, the Government Accountability Board completed the recount and certified Prosser as the winner.

The final count found Prosser leading Kloppenburg by 7,004 votes, a 0.46% margin of victory

This article will be updated.

You Might Also Like

Hagedorn Leads in Stunning Upset Over Neubauer

Graphic for the Generic Ballot, otherwise known as the Generic Congressional Ballot or Generic House Vote. (Photo: Adobe Stock/PPD)
Graphic for the Generic Ballot, otherwise known as the Generic Congressional Ballot or Generic House Vote. (Photo: Adobe Stock)

In 1948, Gallup had Democratic President Harry S. Truman trailing Republican Thomas E. Dewey by 5 points, 49.5% to 44.5%. President Truman won the popular vote 49.6% to 45.1%, and the Electoral College 303 to 189.

It would be six decades before Gallup misfired again, when they underestimated Barack Obama’s support in 2012.

The 2016 presidential election wasn’t the first major polling blunder in U.S. electoral history. But it was the worst if for no other reason than it resulted in us losing the public trust.

It was a near-universal, industry-wide failure outside of a handful of us.

I’ve long been a critic of “Gold Standard” pollsters and methodologies. Admittedly, I had genuine high hopes the 2016 failure would lead to a productive conversation.

In interviews and columns, I’ve tried to start that conversation with data sourcing, collection modes, response bias, response rates, weighting for party identification while ignoring region and education.

And yes, even about ideological corruption.

Those efforts have not been in vain, nor a complete disappointment. You’d never know it from media coverage, but pollsters and data providers have been asking themselves tough questions.

But as we approach the 2020 presidential election cycle, it’s becoming clear big media polling critics and analysts have taken few lesson to heart. Instead, they are overstating the performance of their outlets, ignoring significant failures, and attacking those who won’t run with the herd.

Those attacks typically have two targets–the pollster and, of course, the president–and are not designed to advance any conversation to the benefit of the industry.

Take a recent article from Philip Bump at The Washington Post.

To attack President Donald Trump, Mr. Bump trashes Rasmussen Reports. Unlike the pollster employed by the same outfit as Mr. Bump, Rasmussen called the last presidential election correctly.

Trump also likes to cherry-pick polls that show what he wants to see — such as the consistently generous polls from Rasmussen Reports that several times have shown him with much more robust support from black Americans than other pollsters.

All politicians cherry-pick polls. But it’s worth noting Rasmussen is not alone in measuring increased support for the president among black voters. Pew Research, YouGov and our own polling at Big Data Poll have measured volatile but notably higher levels of support among both black and Hispanic voters.

It is the educated white suburban swing voter weighing down the president’s numbers. But I digress.

“The RealClearPolitics average of polls at the end of the election estimated Democrats would win seven percentage points more of the House vote,” he continued. “Rasmussen’s last poll had the Republicans winning that vote.”

A column by Harry Enten for CNN repeated a similar criticism, referring to Rasmussen as “the least accurate” to estimate the House popular vote.

Mr. Enten wrote the “midterm elections prove that at least for now Rasmussen is dead wrong and traditional pollsters are correct.”

Nate Silver, in a tweet also aimed at attacking the president, claimed Rasmussen “said that Republicans would win the popular vote for the U.S. House.”

First, it is not true that 2018 proved “traditional polls are correct.” Putting aside their specific focus only on the generic ballot to vindicate a debacle that continued throughout 2017, big media pollsters can at best claim a mixed record for 2018.

Playing right into deep public distrust, those inaccuracies again favored Democratic candidates in both timing and topline-driven headlines. It might be convenient for them to ignore their poor state-level track record, but it doesn’t make it untrue.

CNN, the very outfit for which Mr. Enten wrote that article, missed the gubernatorial contest in Florida by 13 points. They herded less than a week later for the record, a poll that never saw coverage.

Quinnipiac University, another big media favorite “traditional” pollster, had both Democratic candidates with a 7-point edge in Florida.

They both lost.

Rasmussen was actually more accurate in September, finding defeated incumbent Democratic Senator Bill Nelson leading now-Republican Senator Rick Scott by just 1 point.

CNN missed in Tennessee by 7 points, laughably claiming a competitive race within the margin between now-Republican Senator Marsha Blackburn and Democrat Phil Bredesen. The Democrat was defeated by nearly 11 points.

In Ohio, not a single poll gave Republican Governor Mike DeWine the lead over Democrat Richard Cordray in the final months. The oft-cited NBC News/Marist Poll had Governor DeWine leading in June, but herded to a tie in their late-September survey.

The same poll gave defeated incumbent Democrat Claire McCaskill a 3-point lead over now-Republican Senator Josh Hawley, a 9-point miss. They missed by 6 points in Tennessee, a bias favoring the defeated Democrat.

The Fox Poll was equally unreliable, giving defeated incumbent Democrat Joe Donnelly a 7-point edge over now-Republican Senator Mike Braun in Indiana. It was a 13-point miss. In Missouri, Fox had McCaskill tied with Hawley, a near 7-point miss.

I could go on and on and on and on. But as we get closer to 2020, a race that will be be decided at the state level, Americans should know big media pollsters have not corrected their mistakes.

Criticizing Rasmussen Reports because the president tweets their approval polls, won’t change that. Only an honest conversation will.

It’s true the final Rasmussen General Congressional Ballot gave Republicans a 1-point edge in 2018, but they left out some important details.

It is also important for Americans to understand that the community of “analysts” and “forecasters” largely are not pollsters. Those who do this for a living and put themselves out for scrutiny year-after-year, know the impact survey wording and ordering can have.

It is not entirely true Rasmussen “said that Republicans would win the popular vote for the U.S. House,” as Mr. Silver tweeted. Their predicted composition of the electorate was fairly accurate, but their survey wording was convoluted.

This is how we typically ask the generic ballot question at Big Data Poll.

Thinking ahead to November, if the election in your Congressional District was held today, would you vote for the Republican candidate, the Democratic candidate, or someone else?

We make it clear we are asking about the respondent’s vote preference by party for the U.S. House by including “Congressional District.” Here is how the Rasmussen Reports Generic Ballot is worded.

If the elections for Congress were held today, would you vote for the Republican candidate or for the Democratic candidate?

There is no specific reference to the U.S. House. Personally, I feel wording the question like this poses a danger respondents might give their preference for either chamber.

They acknowledged that lack of distinction in an article published on the Friday following the election, and that “party preference are both combined into the concept of ‘Congress.'” Given the survey wording and split result of the 2018 midterms, the final topline doesn’t surprise me.

Republicans lost a slightly higher than average number of seats in the U.S. House for a first-term incumbent party midterm. They won an above average number in the U.S. Senate, the most since 1962.

Nevertheless, to ignore the pollster’s response and your own outlet’s failures, is double disingenuous.

Americans would never know it, but the private polling industry doesn’t operate like this. We talk “to” each other and learn from each other. Big media talks “at” each other and you, and learns nothing from either.

Polling critics are overstating the performance of

A Boeing 737 MAX plane is seen during a media tour of the Boeing 737 MAX at the Boeing plant in Renton, Washington December 7, 2015. (Photo: Reuters)

New orders for durable goods decreased less than expected in February, declining $4.2 billion (1.6%) to $250.6 billion. The less-than-anticipated decrease follows three consecutive monthly increases, and a 0.1% gain in January.

Excluding transportation, new orders for durable goods increased 0.1%, beating the forecast. Excluding defense, new orders decreased 1.9%, missing the forecast.

The consensus forecast for the headline was -1.8%, ranging from a low of -4.0 to a high of -0.5%. For core capital goods, the consensus came in at 0.2%, ranging from a low of 0.1% to a high of 0.3%. The consensus for transportation goods was unchanged (0.0%), ranging from a low of -0.3% to a high of 0.4%.

Durable goods are manufactured items not for immediate consumption and are meant to last for a period of at least three years. The full report from the U.S. Census Bureau can be found here,

New orders for durable goods decreased less

Markets concept depicting the American flag draped over the New York Stock Exchange (NYSE) at Wall Street. (Photo: AdobeStock)

Major Market Averages rallied Monday on strong economic data from the U.S. Census Bureau. The S&P 500 (^SPX) closed at the highest level since the second week of October 2018 and is just 2% off its all-time high.

The index was +32.79, or +1.16% to close at 2,867.19, the highest level since October 9, 2018 when it was 2,880.34. The 52-week and all-time is 2,869.35.

Retail sales were down 0.2% in February, sales are up 2.7% on the year. Total sales for the period from December 2018 through February 2019 were up 2.2% (±0.5%) from the same period a year ago. The December 2018 to January 2019 percent change was revised from up 0.2% (±0.5%) to up 0.7% (±0.3%).

Construction spending continued to unexpectedly gain during February, rising solidly 1.0% to a seasonally adjusted annual rate of $1,320.3 billion. That’s (±0.8%) above the revised January estimate of $1,307.3 billion, and beating the forecast range.

The Institute for Supply Management (ISM) manufacturing index (PMI) came in at a solid 55.3 in March, beating the consensus forecast. That’s up 1.1 percentage points from February and new orders remain very solid.

The consensus forecast was 54.2, ranging from a low of 53.0 to a high of 55.5.

Meanwhile, the Dow Jones Industrial Average (^DJI) was +329.74, or 1.27% higher to close at 26,258.42. The Dow is following its best quarter in nearly a decade.

The NASDAQ Composite (^IXIC) was +99.59, or 1.29% higher to close at 7,828.91.

The S&P 500 (^SPX) closed at the

New Orders, Employment Indexes Signal Acceleration in Manufacturing Sector Growth and Employment

Manufacturing industry production concept, depicting factory production on a conveyor belt with factory operational workers in uniform. (Photo: AdobeStock)

The Institute for Supply Management (ISM) manufacturing index (PMI) came in at a solid 55.3 in March, beating the consensus forecast. That’s up 1.1 percentage points from February and new orders remain very solid.

The consensus forecast was 54.2, ranging from a low of 53.0 to a high of 55.5.

“Comments from the panel reflect continued expanding business strength, supported by gains in new orders and employment,” Timothy R. Fiore, Chair of the ISM Manufacturing Business Survey Committee, said.

“Demand expansion continued, with the New Orders Index returning to the high 50s, the Customers’ Inventories Index improving but remaining too low, and the Backlog of Orders Index softening to marginal expansion levels.

The New Orders Index came rose 1.9% to a strong 57.4%, up from the February reading of 55.5%. The Production Index gained 1 point from 54.8% to 55.8%.

The Employment Index shot up 5.2% from 52.3% to 57.5%, indicating a solid number of manufacturing jobs in the upcoming jobs report. The Supplier Deliveries Index declined 0.7% from 54.9% to 54.2%.

The Inventories Index fell 1.6% from 53.4% to 51.8%, while the Prices Index rose 4.9% from 49.4% to 54.3%, indicating a return of increasing raw materials prices after a two-month respite.

Of the 18 manufacturing industries, 16 reported growth in March. Only Apparel, Leather and Allied Products and Paper Products reported contraction.

Manufacturing Panel Responses

  • “Customer orders remain strong.” (Textile Mills)
  • “The electronics industry seems to be slowly coming out of crisis mode. Lead times and costs have leveled out in some commodities, and dynamic random access memory (DRAM) prices are actually coming down.” (Computer & Electronic Products)
  • “Brexit continues to be a concern, despite the fact that our organization has already rolled out a plan to minimize its impact.” (Chemical Products)
  • “Business remains very strong amid rumors of a slowdown, but forecasts do not indicate this. Electronics are at tight capacity from manufacturers, with no [change] in the near future.” (Transportation Equipment)
  • “Strong customer orders continue.” (Food, Beverage & Tobacco Products)
  • “Current weather conditions causing significant delivery delays [and] diminishing our production capabilities.” (Machinery)
  • “Strong business momentum coming into January and early February has slowed to typical seasonal business conditions for our industry.” (Miscellaneous Manufacturing)
  • “General procurement levels remain strong based on demand. Backlog for domestic new and repaired equipment continues to grow. Production meeting customer delivery requirements is a challenge. Still experiencing a skills gap in hiring qualified shop personnel, machinists and mechanics.” (Fabricated Metal Products)
  • “Steel tariffs continue to put upward pressure on our input costs. The government shutdown delayed the process of gaining exemptions to the tariffs.” (Petroleum & Coal Products)
  • “Awaiting with anticipation the outcome of the U.S.-China trade deal.” (Plastics and Rubber Products)
  • “Experienced a reduction in orders, with forecasted softness going into Q2.” (Primary Metals)
  • “Weather in the domestic market is constraining homebuilding across the nation — too wet in the south, severe winter in the north. Expectations are that homebuilding backlog is growing, and a surge of domestic business will come in May and June. Internationally, the Chinese trade war is still holding business back, but expectations are that in April or May, business will spring back materially as tariffs resolve.” (Wood Products)
  • “Skilled labor is still tough to find.” (Apparel, Leather & Allied Products)
  • “Steel in U.S. remains strong, driving numerous product lines.” (Nonmetallic Mineral Products)
  • “Business is very strong and has been for over two years.” (Furniture & Related Products)

The Institute for Supply Management (ISM) manufacturing

A team of millennial business owners collaborating on an online project using a touchpad tablet in a modern office space. (Photo: AdobeStock/AYAimages)

Business inventories for manufacturers and trade in January rose 0.8% (±0.1%) from December to $2,013.9 billion, beating the forecast and outpacing sales. They are up 5.3% (±0.4%) from January 2018.

The consensus forecast was 0.5%, ranging from a low of 0.1% to a high of 0.6%. All data are adjusted for seasonal and trading day differences but not for price changes.

Sales are lagging, which often serves as a red flag for a slowdown.

The combined value of distributive trade sales and manufacturers’ shipments for January was estimated at $1,449.6 billion, up 0.3% (±0.3%) from December 2018 and 2.8% (±0.3%) from January 2018.

The total business inventories/sales ratio based on seasonally adjusted data at the end of January was 1.39. The January 2018 ratio was 1.36.

Business inventories for manufacturers and trade in

January Construction Spending Revised Even Higher, From 1.3% to Strong 2.5%

New residential construction, hew homes, housing starts, building permits, depicted on blueprints. (Photo: AdobeStock)

Construction spending continued to gain solidly during February, gaining 1.0% to a seasonally adjusted annual rate of $1,320.3 billion. That’s (±0.8%) above the revised January estimate of $1,307.3 billion, and beating the forecast range.

The consensus forecast was calling for a -0.2% reading, ranging from a low of -1.0% to a high of 0.4%.

The February figure is 1.1% (±1.5%) above the February 2018 estimate of $1,305.5 billion. During the first two months of this year, construction spending amounted to $181.9 billion, 1.4% (±1.3%) above the $179.4 billion for the same period in 2018.

The month of January was revised even higher from 1.3% to a very strong 2.5%.

Private Construction

Spending on private construction was at a seasonally adjusted annual rate of $994.5 billion, 0.2% (±0.8%) above the revised January estimate of $993.0 billion. Residential construction was at a seasonally adjusted annual rate of $540.9 billion in February, 0.7% (±1.3%) above the revised January estimate of $536.9 billion.

Nonresidential construction was at a seasonally adjusted annual rate of $453.6 billion in February, 0.5% (±0.8%) below the revised January estimate of $456.0 billion.

Public Construction

In February, the estimated seasonally adjusted annual rate of public construction spending was $325.8 billion, 3.6% (±1.6%) above the revised January estimate of $314.4 billion.

Educational construction was at a seasonally adjusted annual rate of $76.3 billion, 0.8% (±2.0%) above the revised January estimate of $75.7 billion. Highway construction was at a seasonally adjusted annual rate of $111.1 billion, 9.5% (±5.3%) above the revised January estimate of $101.5 billion.

Construction spending continued to gain solidly during

People's Pundit Daily
You have %%pigeonMeterAvailable%% free %%pigeonCopyPage%% remaining this month. Get unlimited access and support reader-funded, independent data journalism.

Start a 14-day free trial now. Pay later!

Start Trial