Widget Image
Follow PPD Social Media
Sunday, January 12, 2025
HomeStandard Blog Whole Post (Page 124)

GOP Candidates Flipped Senate District 6, Assembly District 99

Voting, elections and state polls concept: Ballot box with state flag in the background - Connecticut. (Photo: AdobeStock)
Voting, elections and state polls concept: Ballot box with state flag in the background – Connecticut. (Photo: AdobeStock)

The Republican Party scored two big upsets in Connecticut on Tuesday, flipping a district under Democratic control for roughly a quarter-century.

Gennaro Bizzarro defeated Democrat Rick Lopes in Senate District 6, 53.01% to 43.69%. In 2016, Hillary Clinton carried the district against Donald Trump by 26 points.

In November 2018, Democrat Terry Gerratana defeated Republican Robert Smedley 58.63% to 37.41%.

Meanwhile, Republican Joseph Zullo defeated Democrat Josh Balter in Assembly District 99 by a margin of 51.44% to 43.18%.

All five special elections were held to fill vacancies created when Governor Ned Lamont appointed Democratic incumbents to his administration in January.

“While turnout was low, those are swings that catch our eye over here,” Rich Baris, the Director of PPD’s Election Projection Model said. “We’re looking at margins and at demographics. Tonight was not the first warning sign for Democrats heading into 2020.”

On February 19, Democrat Ibraheem S. Samirah won the special election in Northern Virginia for House of Delegates District 86, but the vote share swung Republican by double-digits.

Mr. Samirah was the first Democrat to fail to crack the 60-percent threshold in the deeply Democratic district since 2015.

The Republican gains in Connecticut and NoVa followed a Democratic loss in Minnesota Senate District 11. The special election on February 5 saw a 16-point swing to Republicans.

The seat had been controlled by 3 generations of one Democratic family for over 20 years.

President Trump carried District 99 in 2016, a blue collar district indicative of the shift in political coalitions. Mr. Lopez was endorsed by the union-backed Working Families Party.

Democrats still retain solid majorities in the state legislature, including of 91-60 majority in the General Assembly and 22-14 in the Senate.

UPDATE: The Republican National Committee (RNC) weighed in on what were clearly favorable results for them.

“Republicans just flipped two Democrat seats in Connecticut!” RNC Chairwomen Ronna McDaniel tweeted. “Democrats have held both for years – one of them for more than a quarter-century.”

“Great news for the state and our party!”

“BIG @CTGOP upset tonight in Connecticut! Republicans FLIPPED two seats in today’s special elections,” the Republican Party tweeted.

“Congratulations to Gennaro Bizzarro of CT’s SD-6 (a seat previously held by Dems for nearly a quarter century) and Joe Zullo of CT’s HD-99!”

Republican scored two upsets in Connecticut on

Democratic Party nomination intra-party fight concept as two mountain cliffs each shaped as a donkey clash head to head damaging the party as a 3D illustration. (Photo: AdobeStock)

As of this writing, there are sixteen formally declared candidates for the 2020 Democratic nomination. For those who may be concerned by the lack of choices, they need not.

There are another fifteen who have either speculated or are seriously considering getting into the race, including former New York City Mayor Michael Bloomberg, Vice President Joe Biden and Ohio Senator Sherrod Brown.

If all currently declared candidates stay the course until the 2020 Democratic National Convention (July 13-16) and are joined by only four more, which seems more than likely, it will have surpassed the 19 hopefuls at the disastrous convention in 1924.

The 1924 Democratic Convention in Madison Square Garden, which almost destroyed the party, began on June 24 and ran until the summer heat exhausted delegates. Without air conditioning or alcohol, the delegates gave up after 16 days on July 9 and chose an outsider former Congressman John W. Davis of West Virginia.

Mr. Davis started off with just 31 votes on the first ballot. It was 103 ballots before it mercifully ended.

The reason for this endless run of ballots was a massive split on major issues and acrimony between the supporters of two leading candidates, Governor Alfred E. Smith of New York and former Secretary of State William Gibbs McAdoo.

The intra-party fights centered on prohibition.

Governor Smith was a Catholic and committed “wet” who opposed prohibition, while McAdoo was a Protestant who supported it. To top it off, the Ku Klux Klan (KKK) was present and front-and-center .

The KKK was near the height of its power and influence, and the convention had to deal with it. A plank proposal to condemn the Klan as a violent organization was narrowly defeated and, with that, the convention got down to business.

Unfortunately for the delegates, the convention was run under the two-thirds rule, mercifully abandoned in 1936 whereby the nominee had to have the support of two-thirds of the delegates and the unit rule.

Not abandoned until 1968 because it gave disproportionate power to southern delegates, the unit rule meant an entire state’s delegation had to vote for whichever candidate had a simple majority of support among its members.

The 1924 delegates were not released from their drudgery after 103 ballots as a vice presidential still had to be chosen. Twelve were initially nominated (in 5 minute speeches) and eventually 30 received votes, including three women.

Charles W. Bryan of Nebraska was chosen because he happened to be the brother of three-time losing presidential nominee William Jennings Bryan. The ticket of Davis, who admitted the nomination, was worthless, and Bryan suffered a massive loss to President Coolidge 54% to 29%.

A progressive earned roughly 17%.

That the 2020 version of the Democratic Party and its abundance of candidates are not without issues of political positioning and potentially destructive personality clashes on the campaign trail as the actual state elections hove into view, is obvious.

It is these internal issues rather than the external ones that so divided the 1924 delegates. Similarly, internal issues have the potential for a disastrously acrimonious 2020 convention whose eventual nominees may suffer the same fate.

If the field has not winnowed down by convention time the DNC’s proportional delegate allocation regarding state primary elections, especially in the case of California would ensure no candidate will have a majority on the opening ballot or ballots.

In the old days, state bosses would hold their states’ “favorite son” votes back to exchange them for a major cabinet post or other position when they sensed a deadlock could be broken. This is not available nowadays. But as a substitute “superdelegates” are in somewhat of a similar position.

The problem is that even now the candidates are split into ideological factions.

Kobluchar/Brown/O’Rourke/Booker could represent the center-left juxtaposed to traditionalists like Bloomberg/Biden, leaving leftists in the mold of Harris/Warren/Sanders.

Superdelegates only control about 15% of the vote, are unlikely to coalesce around any one candidate. Even with candidate’s horse-trading, holding out a VP slot is challenging as they can’t offer such a plum to a similar positioned gendered or colored opponent. Such are the vagaries that identity politics have thrust on Democrats through their own mechanisms and machinations.

The 1960 and 1968 conventions were strongly contested, yet delegates only needed one ballot. In 2020, the scene is set not only for the first genuinely contested, multi-ballot Democratic convention since 1952, but also the most divisive since 1924.

The GOP can only rub their hands with glee at this possibility.

In 2020, the scene is set not

Philly Fed Alone Posted Weak Regional Manufacturing Activity in February

An American Flag flying in front of a U.S. manufacturing factory. (Photo: AdobeStock)

The Federal Reserve Banks of Dallas and Richmond joined New York in posting strengthening regional manufacturing activity for February, leaving Philadelphia the sole region to indicate weakness ahead of a national report.

On Monday, Texas Manufacturing Outlook Survey found factory activity continued to expand in February, although the production index fell 4 points to 10.1.

The general business activity index jumped 12 points to 13.1 after posting two consecutive months of weak readings. The consensus forecast was looking for a reading of just 4.8, with forecasts ranging from a low of 2.0 to a high of only 11.7.

The employment index rebounded from 6.6 to 12.6. Twenty-two percent (22%) of firms saw net hiring, while just 9% saw net layoffs. Further, the future looked bright to manufacturers in the region.

The indexes of future general business activity and future company outlook rose to 17.7 and 26.7, respectively. While other indexes for future manufacturing activity fell, they remained solidly positive.

On Tuesday, the Richmond Fed Fifth District Survey of Manufacturing Activity saw the composite index jump from −2 in January to 16 in February.

Forecasts ranged from a low of 0 to a high of 8. The consensus forecast was looking for a reading that improved to only 3. Both the employment and wages indexes remained solid in, but firms continued to cite a struggle to find skilled workers.

The Empire State Manufacturing Survey–the first regional factory activity to be released each month–posted a reading that rebounded sharply in February to beat the consensus forecast, as both the general and expectations gauges indicate solid growth.

The headline general business conditions index doubled from the month prior, rising 5 points to 8.8. The new orders index rose 4 points to 7.5.

A week later, the Philly Fed Manufacturing Business Outlook Survey weakened in February, falling to -4.1 and missing the forecast. It was the index’s first negative reading since May 2016.

Despite internals remaining solid, the survey was the talk of traders and talking heads.

The diffusion index for future general activity held steady this month at a solid 31.3. More than 46% of the firms expect increases in activity over the next six months, while just 15% expect declines.

Nevertheless, with the regional manufacturing surveys wrapping up for February, it would appear regional weakness posted by the Philly Fed was the outlier, not the norm.

On Friday, the Institute for Supply Management Manufacturing Index (PMI) for national factory activity will be released. Forecasts range from a low of 53.0 to a high of 57.2, with 55.0 being the consensus.

While still solid growth, it would mark a decline from a reading of 56.6 from January.

The Federal Reserve Banks of Dallas and

Sale, consumerism and people concept - happy family with child and shopping cart buying food at grocery store or supermarket. (Photo: PPD/AdobeStock/Syda Productions)
Sale, consumerism and people concept – happy family with child and shopping cart buying food at grocery store or supermarket. (Photo: PPD/AdobeStock/Syda Productions)

Consumer confidence bounced back big time in February, rising 9.7 points from 121.7 in January to 131.4 (1985=100), crushing the consensus forecast.

The consensus was looking for 125.0, and forecasts ranged from a low of 119 to a high of 127.5. This solid gain follows what was a temporary decline in January due to “temporary shock,” or fear-mongering over the partial government shutdown.

The Present Situation Index – which is based on consumers’ assessment of current business and labor market conditions – rose from 170.2 to 173.5. The Expectations Index – which is based on consumers’ short-term outlook for income, business and labor market conditions – shot up from 89.4 to 103.4.

“Consumer Confidence rebounded in February, following three months of consecutive declines,” said Lynn Franco, Senior Director of Economic Indicators at The Conference Board. “The Present Situation Index improved, as consumers continue to view both business and labor market conditions favorably.”

“Expectations, which had been negatively impacted in recent months by financial market volatility and the government shutdown, recovered in February.”

Consumers’ views of current conditions improved in February, albeit modestly.

Those stating business conditions are “good” rose from 36.4% to 41.2%, while those saying business conditions are “bad” was flat at 10.8%. Consumers’ assessment of the labor market was a mixed bag.

While the percentage stating jobs are “plentiful” fell marginally from 46.7% to 46.1%, those claiming jobs are “hard to get” also declined marginally, from 12.6% to 11.8%.

“Looking ahead, consumers expect the economy to continue expanding,” Director Franco added. “However, according to The Conference Board’s economic forecasts, the pace of expansion is expected to moderate in 2019.”

Consumers’ optimism about the short-term future sharply rebounded from January.

The percentage of consumers expecting business conditions will improve over the next six months rose from 16.3% to 19.7%, while those expecting business conditions to worsen fell from 13.8% to 8.9%.

Consumers’ outlook for the labor market, which continues to demonstrate strength and tightening, was also more favorable. The percentage expecting more jobs in the months ahead rose from 15.3% to 18.5%, while those expecting fewer jobs fell from 16.2% to 12.2%.

Regarding their short-term income prospects, 20.0% expect an improvement, up from 17.7%. But the proportion expecting a decline also rose, from 6.8% to 8.5%.

The monthly Consumer Confidence Survey is based on a probability-design random sample and conducted for The Conference Board by Nielsen.

The cutoff date for the preliminary results was February 15.

Consumer confidence bounced back big time in

Real Estate Market Going Up Concept Illustration. (Photo: AdobeStock)

The Federal Housing Finance Agency (FHFA) House Price Index (HPI) finds U.S. house prices rose 1.1% in the fourth quarter (Q4) of 2018, and 5.7% from Q4 2017.

FHFA’s seasonally adjusted monthly index for December was up 0.3% from November. That is slightly lower than the 0.4% consensus forecast.

Forecasts for the month ranged from a low of 0.3% to a high of 0.5%. Nevertheless, as was present in the S&P CoreLogic Case-Shiller HPI also out this morning, appreciation in home prices moderated toward the end of 2018.

The HPI is calculated using home sales price information from mortgages sold to, or guaranteed by, Fannie Mae and Freddie Mac.

“House prices rose throughout 2018 but at a slower rate than in recent years,” said Dr. William Doerner, Supervisory Economist. “In the fourth quarter, house price appreciation hit one of the lowest levels in the past four years.”

Specifics via FHFA (H/T)

  • Home prices rose in all 50 states and the District of Columbia between the fourth quarters of 2017 and 2018.  The top five areas in annual appreciation were: 1) Idaho 11.9 percent; 2) Nevada 11.2 percent; 3) Utah 9.8 percent; 4) Georgia 8.2 percent; and 5)Arizona 8.2 percent.  The areas showing the smallest annual appreciation were:  1) North Dakota 0.0 percent; 2) Connecticut 0.9 percent; 3) West Virginia 1.6 percent; 4) Louisiana 1.8 percent; and 5) Oklahoma 2.0 percent.
  • Home prices rose in 98 of the 100 largest metropolitan areas in the U.S. over the last four quarters.  Annual price increases were greatest in San Francisco-San Mateo-Redwood City, CA (MSAD), where prices increased by 17.0 percent.  Prices were weakest inUrban Honolulu, HI, where they fell by 2.0 percent.
  • Of the nine census divisions, the Mountain division experienced the strongest four-quarter appreciation, posting an 8.1 percent gain between the fourth quarters of 2017 and 2018 and a 1.6 percent increase in the fourth quarter of 2018.  Annual house price appreciation was weakest in the West South Central division, where prices rose by 4.3 percent between the fourth quarters of 2017 and 2018.

The FHFA House Price Index (HPI) reported

Impact of Interest Rate Pullback Lags December S&P CoreLogic Case-Shiller HPI

A under contract sign on a home previously for sale in Vienna, Va. (Photo: Reuters)

The S&P CoreLogic Case-Shiller National Home Price NSA Index covering all nine U.S. census divisions posted a 4.7% annual gain in December, down from 5.1% in the previous month.

S&P CoreLogic Case-Shiller Home Price Indices overall closed out 2018 indicating a slowing in appreciation.

“The annual rate of price increases continues to fall,” says David M. Blitzer, Managing Director and Chairman of the Index Committee at S&P Dow Jones Indices. “Even at the reduced pace of 4.7% per year, home prices continue to outpace wage gains of 3.5% to 4% and inflation of about 2%.”

The 10-City Composite annual increase came in at 3.8%, down from 4.2%. The 20-City Composite saw a 4.2% year-over-year gain, down from 4.6% and slightly less than the 4.8% consensus forecast.

“A decline in interest rates in the fourth quarter was not enough to offset the impact of rising prices on home sales,” Mr. Blitzer added. “The monthly number of existing single family homes sold dropped throughout 2018, reaching an annual rate of 4.45 million in December.”

“The 2018 full year sales pace was 4.74 million.”

Las Vegas, Phoenix and Atlanta led the way in the highest year-over-year gains among the 20 cities. In December, Las Vegas saw an 11.4% year-over-year price increase, followed by Phoenix with an 8.0% gain and Atlanta with a 5.9% gain.

Three of the 20 cities reported greater price increases in the year ending December 2018 juxtaposed to the year ending November 2018.

“Regional patterns continue to shift. Seattle and Portland, OR experienced the fastest price increases of any city from late 2016 to the spring of 2018; in December, they ranked 11th and 16th,” Mr. Blitzer said. “Currently, the cities with the fastest price increases are Las Vegas and Phoenix.”

He also noted that Las Vegas and Phoenix are the furthest below their 2006 peaks of any city followed in the S&P CoreLogic Case-Shiller Indices.

The S&P CoreLogic Case-Shiller National Home Price

The Democrat Party is up to their same old tricks we saw in 2016 and don’t realize it is why Americans chose Donald J. Trump, and probably will again in 2020.

*AOC Lunacy
*Pence and Venezuela
*Fake Crime Study
*DNC Will Pick a Sucker
*Reparations for Blacks?

Bumper Music:

Barbie- Aqua
Rocket Man- Elton John
Someone Saved My Life Tonight= Elton John
The Name of the Game- Abba
I Want it All- Armageddon/Queen

Closing Music on podcast provided by The Dead Cat Bounce*

To help our show out, please support us on Patreon: https://www.patreon.com/LibertyNeverSleeps

The money pledged thru Patreon.com will go toward show costs such as advertising, server time, and broadcasting equipment. If we can get
enough listeners, we will expand the show to two hours and hire additional staff.

All bumper music and sound clips are not owned by the show, are commentary, and of educational purposes, or de minimus effect, and not for monetary gain.

No copyright is claimed in any use of such materials and to the extent that material may appear to be infringed, I assert that such alleged infringement is permissible under fair use principles in U.S. copyright laws. If you believe material has been used in an unauthorized manner, please contact the poster.

The Democrat Party is up to their

New Residential Construction Report Lags Builder Confidence Boost

New residential construction, hew homes, housing starts, building permits, depicted on blueprints. (Photo: AdobeStock)

The U.S. Census Bureau said housing starts fell short of the forecast for December, while building permits beat expectations. The new residential construction report covers a period that lags a boost in builder confidence in February.

Building Permits

Building permits in December came in at a seasonally adjusted annual rate of 1,326,000, or 0.3% (±1.2%) higher than the revised November rate of 1,322,000 and is 0.5% (±1.1%) above the December 2017 rate of 1,320,000.

The consensus forecast was 1,290,000, with forecasts ranging from a low of 1,230,000 to a high of 1,305,000.

Single‐family authorizations in December were at a rate of 829,000; this is 2.2% (±0.7%) below the revised November figure of 848,000.

Authorizations of units in buildings with five units or more were at a rate of 460,000 in December. An estimated 1,310,700 housing units were authorized by building permits in 2018.

This is 2.2% (±0.6%) above the 2017 figure of 1,282,000.

Housing Starts

Housing starts in December came in at a seasonally adjusted annual rate of 1,078,000, which is 11.2% (±14.0%) below the revised November estimate of 1,214,000 and 10.9% (±16.1%) below the December 2017 rate of 1,210,000.

The consensus forecast was 1,260,000, with forecasts ranging from a low of 1,200,000 to a high of 1,290,000.

Single‐family housing starts in December were at a rate of 758,000; this is 6.7% (±15.3%) below the revised November figure of 812,000.

The December rate for units in buildings with five units or more was 302,000. An estimated 1,246,600 housing units were started in 2018. This is 3.6% (±2.1%) above the 2017 figure of 1,203,000.

Housing Completions

Housing completions in December came in at a seasonally adjusted annual rate of 1,097,000, or 2.7% (±10.0%) below the revised November estimate of 1,128,000 and 8.4% (±12.2%) below the December 2017 rate of 1,197,000.

Single‐family housing completions in December were at a rate of 790,000; this is 0.1% (±14.0%) above the revised November rate of 789,000. The December rate for units in buildings with five units or more was 296,000.

An estimated 1,191,700 housing units were completed in 2018. This is 3.4% (±3.8%) above the 2017 figure of 1,152,900.

Builder Confidence

Meanwhile, the NAHB//Wells Fargo Housing Market Index (HMI) found builder confidence rose 3 points to 62 for February, beating the consensus forecast.

The National Association of Homebuilders said it is the second consecutive month in which all the HMI indices posted gains.

Look for revisions to this very volatile report in the next month’s release, as well as the result of increased optimism.

The U.S. Census Bureau said housing starts

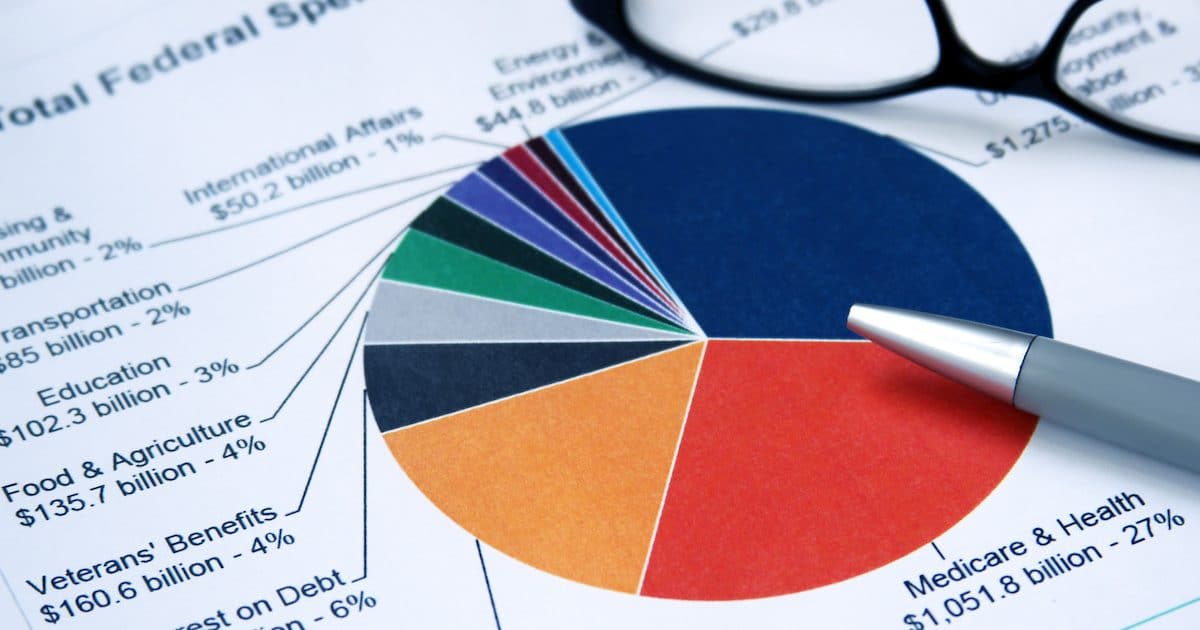
Pie chart depicting total federal spending, or government expenditure categories. (Photo: AdobeStock/GKSD/PPD)

When I’m asked for a basic tutorial on fiscal policy, I normally share my four videos on the economics of government spending and my primer on fundamental tax reform.

But this six-minute interview may be a quicker introduction to spending issues since I had the opportunity to touch on almost every key principle.

Culled from the discussion, here is what everyone should understand about the spending side of the fiscal ledger.

Principle #1 – America’s fiscal problem is a government that is too big and growing too fast. Government spending diverts resources from the productive sector of the economy, regardless of how it is financed. There is real-world evidence that large public sectors sap the private sector’s vitality, augmented by lots of academic research on the negative relationship between government spending and economic performance.

Principle #2 – Entitlements programs are the main drivers of excessive spending. All the long-run forecasts show that the burden of spending is rising because of the so-called mandatory spending programs. Social SecurityMedicare, and Medicaid were not designed to keep pace with demographic changes (falling birthrates, increasing longevity), so spending for these program will consume ever-larger shares of economic output.

Principle #3 – Deficits and debt are symptoms of the underlying problem. Government borrowing is not a good idea, but it’s primarily badbecause it is a way of financing a larger burden of spending. The appropriate analogy is that, just as a person with a brain tumor shouldn’t fixate on the accompanying headache, taxpayers paying for a bloated government should pay excessive attention to the portion financed by red ink.

Principle #4 – Existing red ink is small compared to the federal government’s unfunded liabilities. People fixate on current levels of deficits and debt, which are a measure of all the additional spending financed by red ink. But today’s amount of red ink is relatively small compared to unfunded liabilities (i.e., measures of how much future spending will exceed projected revenues).

Principle #5 – A spending cap is the best way to solve America’s fiscal problems. Balanced budget rules are better than nothing, but they have a don’t control the size and growth of government. Spending caps are the only fiscal rules that have a strong track record, even confirmed by research from the International Monetary Fund and Organization for Economic Cooperation and Development.

Here’s one final principle, though I didn’t mention it in the interview.

Principle #6 – Increasing taxes will make a bad situation worse.Since government spending is the real fiscal problem, higher taxes, at best, replace debt-financed spending with tax-financed spending. In reality, higher taxes loosen political constraints on policy makers and “feed the beast,” so the most likely outcome – as seen in Europe – is that overall spending levels increase and long-term debt actually increases.

In an ideal world, these six principles would be put in a frame and nailed above the desk of every politician, government official, and bureaucrat who deals with fiscal policy.

Not that it would make much difference since their decisions are guided by “public choice” no matter what principles they see at their desk, but it’s nice to fantasize.

Here are a few other observations from the interview.

P.S. Needless to say, I wish limits on enumerated powers were still a guiding principle for fiscal policy. Sadly, the days of Madisonian constitutionalism are long gone.

There are six key principles everyone should

Production-Related Indicators Led Declines for the Month

The Chicago Fed National Activity Index (CFNAI) indicated slower economic growth in January, falling to -0.43 and missing the forecast. The three-month moving average, or CFNAI-MA3, fell to a neutral reading.

The consensus forecast was 0.13, ranging from a low of 0.10 to a high of 0.30.

While the reading is low, it was even lower as recently as May at -0.51 when a fire at a parts supplier threw off auto production for a month. Production again led this month’s decline.

Worth noting, despite the reversal for auto production (+0.8) this month, manufacturing production fell from +0.9 in December to -0.9 in January. It was not related to the government shutdown.

One of the four broad categories of indicators that make up the index decreased from December, and two of the four categories made negative contributions to the index in January.

The CFNAI Diffusion Index, also a three-month moving average, declined only marginally to +0.09 in January from +0.18 in December. Thirty-five (35) of the 85 indicators made positive contributions to the CFNAI, while 50 made negative contributions.

Thirty-eight (38) indicators improved from December to January, while 46 indicators deteriorated and one was unchanged. Of the indicators that improved, 11 made negative contributions.

Nevertheless, due to the shutdown, revisions will be made as late and lagging data are released. It is likely to show far less weakness.

The Chicago Fed National Activity Index (CFNAI)

People's Pundit Daily
You have %%pigeonMeterAvailable%% free %%pigeonCopyPage%% remaining this month. Get unlimited access and support reader-funded, independent data journalism.

Start a 14-day free trial now. Pay later!

Start Trial