New residential construction, hew homes, housing starts, building permits, depicted on blueprints. (Photo: AdobeStock)
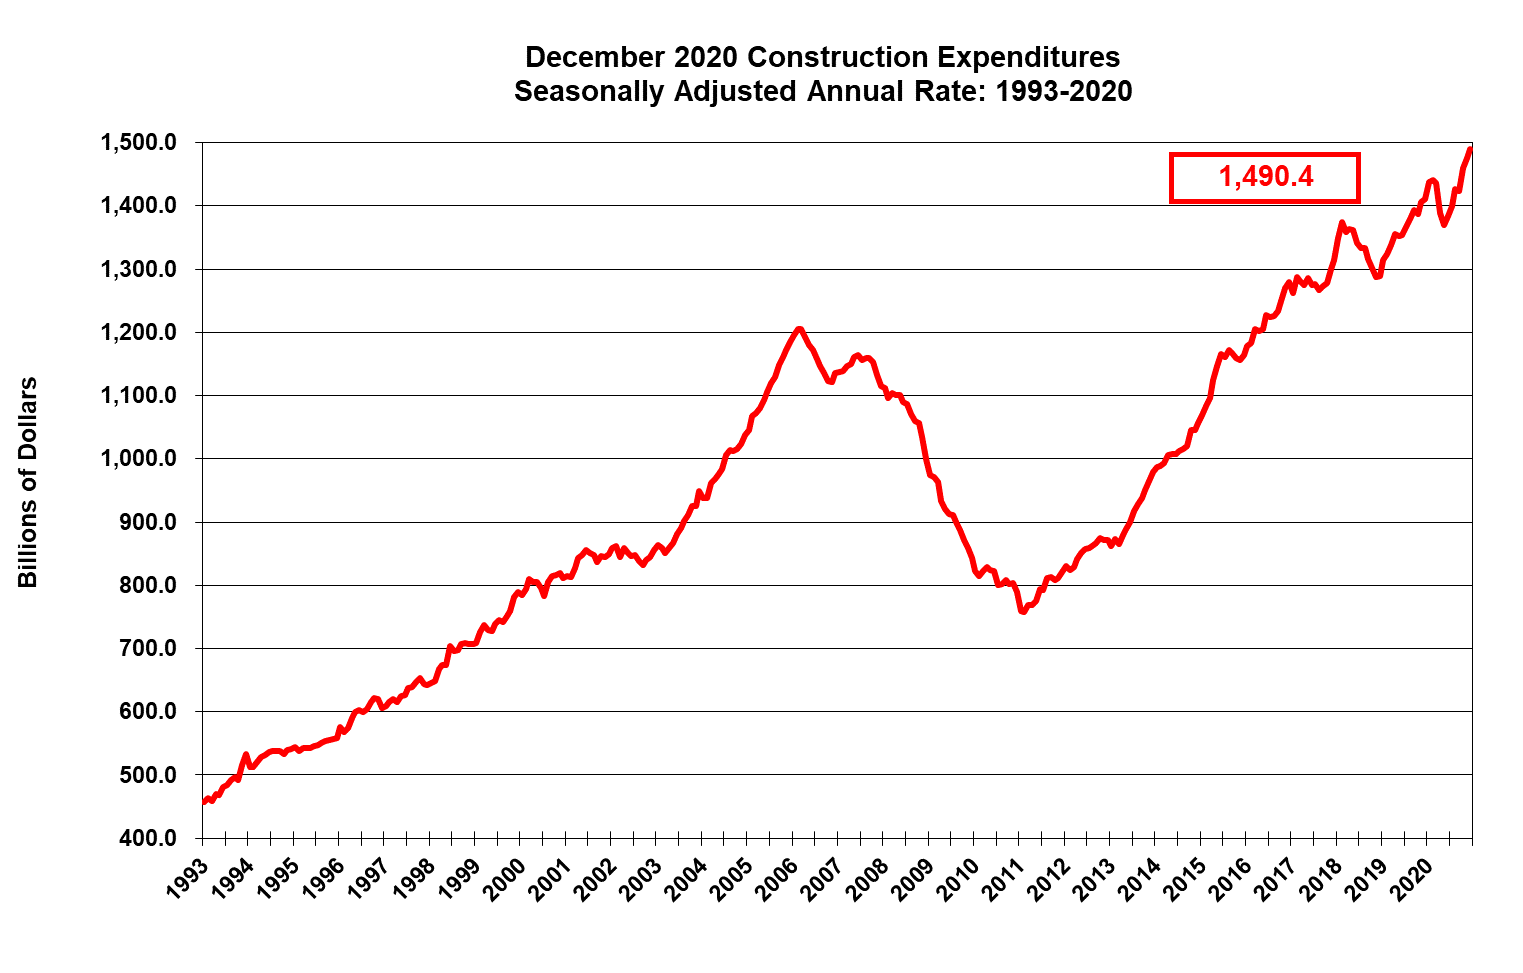
Construction spending gained 0.8% (±1.3%) in November at a seasonally adjusted annual rate of $1,299.9 billion, quadruple the 0.2% consensus forecast.
The range of forecasts spanned from a low of -0.1% to a high of 2.0%. The revised October estimate came in at $1,289.7 billion.
The latest gain in November drove construction spending 3.4% (±1.5%) higher than the November 2017 estimate of $1,257.3 billion.
During the first eleven months of this year, construction spending amounted to $1,200.7 billion, or 4.5% (±1.2%) higher than the $1,149.3 billion for the same period in 2017.
Private Construction
Spending on private construction was at a seasonally adjusted annual rate of $993.4 billion, 1.3% (±0.8%) above the revised October estimate of $980.4 billion. Residential construction was at a seasonally adjusted annual rate of $542.5 billion in November, 3.5% (±1.3%) above the revised October estimate of $524.2 billion.
Nonresidential construction was at a seasonally adjusted annual rate of $450.8 billion in November, 1.2% (±0.8%) below the revised October estimate of $456.1 billion.
Public Construction
The estimated seasonally adjusted annual rate of public construction spending was $306.5 billion in November, 0.9% (±2.3%) below the revised October estimate of $309.3 billion.
Educational construction came in at a seasonally adjusted annual rate of $76.7 billion, or 2.0% (±1.6 percent)* lower than the revised October estimate of $78.3 billion.
Highway construction was estimated at a seasonally adjusted annual rate of $93.4 billion, which is 1.7% (±5.6%)* higher than the revised October estimate of $91.8 billion.
Sale, consumerism and people concept – happy family with child and shopping cart buying food at grocery store or supermarket. (Photo: PPD/AdobeStock/Syda Productions)
The final reading on consumer sentiment in January was slightly higher than the initial estimate of 91.2, roughly in line with the consensus forecast. The preliminary reading for the Survey of Consumers was slightly lower at 90.7.
That was the lowest level since the election of Donald J. Trump as President of the United States, and driven solely from the Index of Consumer Expectations, which rose from 78.3 in the prelim to 79.9 in the final.
Forecasts for the overall Survey of Consumers headline Index of Consumer Sentiment ranged from a low of 89.5 to a high of 96.0, with the consensus being 91.4.
The Current Economic Conditions came in at a still elevated 108.8, though slightly down from the prelim reading of 110.0.
“The typical impact of such ‘crisis’ events is short lived, with consumers quickly regaining lost confidence,” Richard Curtain, chief economist at the Survey of Consumers said. “That is unlikely to occur this time as the deadline for resolution has only been extended until mid February.”
That is a disagreement with the Conference Board, which runs the Consumer Confidence Index. Lynn Franco, the head of the closely-watched gauge, said the impact is likely to be temporary.
Mr. Curtain basis his concern on the new deadline, which is likely to result in an emergency declaration if only a temporary second shutdown.
“Indeed, if the current level of confidence is maintained, it would be consistent with a 2.6% growth in consumer spending in 2019.”
Employees have short meeting in the warehouse to check business inventory levels of goods. First in first out. (Photo: AdobeStock)
The monthly wholesale trade report found inventories rising faster than sales, up a modest 0.3% juxtaposed to a decline of 0.6%.
Sales of merchant wholesalers, except manufacturers’ sales branches and offices, after adjustment for seasonal variations and trading-day differences but not for price changes, were $505.3 billion in November 2018.
That decline (±0.4%) is still 4.0% (±3.5%) higher than the November 2017 level. The September 2018 to October 2018 percent change was revised from the preliminary estimate of down 0.2% (±0.5%)* to down 0.6% (±0.5%).
Meanwhile, total inventories of merchant wholesalers, except manufacturers’ sales branches and offices, after adjustment for seasonal variations but not for price changes, came in at $654.0 billion at the end of November, up 0.3% (±0.2%) from the revised October level.
Total inventories were up 6.5% (±4.4%) from the revised November 2017 level.
The November inventories/sales ratio for merchant wholesalers, except manufacturers’ sales branches and offices, based on seasonally adjusted data, was 1.29. The November 2017 ratio was 1.26.
Prices Index, Declining to 49.6%, Indicates Lower Raw Materials Cost for First Time in Nearly 3 Years
American Manufacturing Sector Graphic Concept. (Photo: AdobeStock)
The Institute for Supply Management (ISM) manufacturing index (PMI) came in at 56.6% for January, an increase of 2.3% that beat the consensus forecast.
Forecasts ranged from a low of 53.0% to a high of 56.8%, with 54.0% being the consensus.
The New Orders Index registered 58.2%, a 6.9% gain from the December reading of 51.3%. The Production Index rose 6.4% to 60.5%, compared to the December reading of 54.1%.
The Employment Index registered 55.5%, a 0.5% decline from the December reading of 56%.
Worth noting, the Labor Department (DOL) via the Bureau of Labor Statistics (BLS) reported in the Employment Situation that manufacturing added 13,000 new jobs, with gains in durable goods (+20,000) offsetting losses in employment in nondurable goods (-7,000).
On Wednesday, the ADP National Employment Report found the goods-producing sector added a total 68,000 private sector jobs, including 33,000 in manufacturing.
Nevertheless, those competing lower figures that the elevated figures, thus a decline in the employment index isn’t all that surprising.
The Supplier Deliveries Index posted at 56.2%, a decline of 2.8% from the December read of 59%.
The Inventories Index came in at 52.8%, up 1.6% from 51.2% the month prior. The Prices Index posted at 49.6%, a 5.3% decrease from the December reading of 54.9%. The latter indicates lower raw materials prices for the first time in nearly 3 years.
“Comments from the panel reflect continued expanding business strength, supported by strong demand and output,” Timothy R. Fiore, Chair of the ISM Manufacturing Business Survey Committee said. “Demand expansion improved with the New Orders Index reading returning to the high 50s, the Customers’ Inventories Index remaining too low, and the Backlog of Orders remaining at a near-zero-expansion level.”
Of the 18 manufacturing industries, 14 reported growth in January, in the following order: Textile Mills; Computer & Electronic Products; Plastics & Rubber Products; Miscellaneous Manufacturing; Furniture & Related Products; Printing & Related Support Activities; Primary Metals; Chemical Products; Transportation Equipment; Machinery; Fabricated Metal Products; Petroleum & Coal Products; Food, Beverage & Tobacco Products; and Electrical Equipment, Appliances & Components.
The only industry reporting contraction in January is Nonmetallic Mineral Products.
“Consumption continued to strengthen, with production expanding strongly and employment continuing to expand at previous-month levels,” Mr. Fiore added. “Inputs — expressed as supplier deliveries, inventories and imports — continued to improve, but are negative to PMI expansion.”
“Inputs reflect an easing business environment, confirmed by Prices Index contraction.”
Series with themes reflecting a certain billionaire politician who won the 2016 presidential election touting a very strong labor market. (Photo: AdobeStock)
The U.S. Bureau of Labor Statistics (BLS) reported the U.S. economy created 304,000 jobs in January, nearly doubling the consensus forecast. The consensus called for 158,000, ranging from 140,000 to 183,000.
The unemployment rate edged up to 4.0%, as more public sector workers entered the private sector.
The labor force participation rate, at 63.2%, and the employment-population ratio, at 60.7%, are up by 0.5 percentage point over the year.
Construction employment added 52,000 new jobs in January, including increases in both nonresidential (+19,000) and residential (+15,000). Employment also rose in heavy and civil engineering construction (+10,000) and residential building (+9,000).
Construction has added 338,000 jobs over the past 12 months.
Mining employment rose by 7,000 and the industry has added 64,000 jobs over the year, the continuation of a reversal from a negative trend under the previous administration.
Manufacturing added 13,000 new jobs, with gains in durable goods (+20,000) offsetting losses in employment in nondurable goods (-7,000).
Manufacturing employment has increased by an astonishing 261,000 over the year, with more than four-fifths of the gain in durable goods industries.
The BLS estimated the private sector absorbed 175,000 furloughed federal workers from the partial government shutdown.
As People’s Pundit Daily (PPD) reported Thursday and the Labor Department confirmed in the report, wages and salaries in the fourth-quarter (Q4) 2018 posted the largest gain since Q3 2008.
The 3.1% increase, which was included in the Employment Cost Index that came in at 0.7%, is the first time in more than a decade that wages and salaries broke 3%.
In January, average hourly earnings (wages) for all employees on private nonfarm payrolls increased by 3 cents to $27.56, following a 10-cent gain in December.
Over the year, wages have gained by 85 cents, or 3.2%.
The change in total nonfarm payroll employment for November was revised up from +176,000 to +196,000, while December was revised down from +312,000 to +222,000.
“Strong headline and a tick up in the unemployment rate means the Federal Reserve can stay on hold despite strong economic growth,” TJM Investments analyst Tim Anderson told PPD from the floor of the New York Stock Exchange (NYSE).
“Yes, unemployment was likely impacted by shutdown, but a very strong headline and 4% means expectations for the fed rate hike won’t change and the labor market is very strong,” Mr. Anderson added. “The headline numbers are every bit as strong as the revisions on a smoothed basis, and wages were revised higher.”
On Wednesday, the ADP National Employment Report found U.S. private sector employment rose by 213,000 jobs from December to January, easily beating the forecast.
“The labor market has continued its pattern of strong growth with little sign of a slowdown in sight,” said Ahu Yildirmaz, vice president and co-head of the ADP Research Institute. “We saw significant growth in nearly all industries, with manufacturing adding the most jobs in more than four years.”
Unlike the Employment Situation from the Labor Department, more commonly referred to as the monthly government jobs report, ADP is sourced by actual, anonymous payroll data of client companies served by ADP.
“The job market weathered the government shutdown well. Despite the severe disruptions, businesses continued to add aggressively to their payrolls,” Mark Zandi, chief economist of Moody’s Analytics, said. “As long as businesses hire strongly the economic expansion will continue on.”
California Senator Kamala Harris, D-Calif., speaks during a committee hearing.
Race relations after eight years of Barack Obama’s presidency, which augured so much for that aspect of his election, were arguably in no better shape in 2017 than they were in 2009. It might be said that the most obvious manifestation was the rise of the Black Lives Matter movement in 2013, hardly a sign of progress.
There is a case to be made that the Trump administration has achieved more racial harmony overall, despite obvious setbacks like Charlottesville.
Black unemployment has fallen to the lowest rate in history. President Trump has pardoned and commuted the sentences of historical and current high-profile figures who have been wronged, and passed bipartisan criminal justice reform legislation, the First Step Act.
Such progress has seen a corresponding rise in President Trump’s approval rating, with polling averaging 16% in one study, a 100% increase over his actual 2016 vote.
Much of the analysis of Trump’s surprising (to the pundit class) election victory has focussed on supposed “white resentment of minorities” as a driving factor.
That these same supposed resentful whites had voted twice for President Obama before turning to then-candidate Trump belies the basic concept no matter the implausible liberal analysis.
But it would be foolish to put aside the whole argument as race challenges have of course not vanished from the American scene.
Given there was a degree of “white resentment,” then what might have been the cause?
It is fair to consider that the same condescension from the liberal elites to the white working class and its economic and social concerns also led to whatever degree of racial resentment may have been present.
This condescension was made strikingly clear in the near automatic response from the progressive left to any criticism of President Obama.
“It’s because he’s black,” “why are you afraid of the scary black man in the White House?” or some other endless variation of the same theme.
If you criticized Mr. Obama, then you clearly are, or at least at heart, a racist.
Eight years of that endless meme being the immediate answer to any and all attempts at dialogue surely contributed to any reasonable person feeling that the left was using an unanswerable cudgel to stifle genuine dissent and concerns.
A Kamala Harris presidency would lay the groundwork for a deeper sense of white resentment as the left would double-down on that meme.
“You are not only a racist but a woman hater, worse, a black woman hater” would immediately appear in all possible variations.
The effect on whites would be compounded after having experienced the same brand of attack under Obama. To have it doubly rendered under Harris would breed a dangerous racial, social and inter-gender environment.
This is not a matter of any conjecture.
Within days of Harris formally announcing her campaign, progressives commenced the meme.
”Voters who might choose Schultz over Kamala Harris (do we need to spell it out for you?) might make a different choice with Bernie Sanders or Sherrod Brown on the ballot.”
And again; “I am worried about the inevitable sexist and racist attacks Harris will probably endure during this campaign. Simply existing as a black woman ensures that Harris is constantly under siege”
Harris tweeted her clear intent to make racism a major focus of her campaign and presumably her presidency.
“Let’s speak an uncomfortable but honest truth with one another: racism, sexism, anti-Semitism, homophobia, and transphobia are real in this country. They are age-old forms of hate with new fuel. And we need to speak that truth so we can deal with it.”
Let’s speak an uncomfortable but honest truth with one another: racism, sexism, anti-Semitism, homophobia, and transphobia are real in this country. They are age-old forms of hate with new fuel. And we need to speak that truth so we can deal with it.
And before any corroborating police investigation, she called the alleged attack on Jussie Smollet a “modern day lynching.”
.@JussieSmollett is one of the kindest, most gentle human beings I know. I’m praying for his quick recovery.
This was an attempted modern day lynching. No one should have to fear for their life because of their sexuality or color of their skin. We must confront this hate.
One would have to go back to the 1948 Strom Thurmond-led States Rights presidential campaign to see such an overt and preposterous, if not genuinely frightening, appeal to the basest instinct in race relations.
“Lynching is a dark and despicable part of our nation’s history, yet it is still not a federal hate crime. Passing a federal anti-lynching law must be a priority for this new Congress.”
Lynching is a dark and despicable part of our nation’s history, yet it is still not a federal hate crime. Passing a federal anti-lynching law must be a priority for this new Congress.
How such statements can possibly indicate a Harris presidency would commence a new era of mutual respect for all, and allow for an unfettered dialogue between opposing points of view, utterly escapes me.
The only recent recorded case of lynching was a random attack in 1981, for which the perpetrator was tried and executed. According to the Tuskegee Institute, there has not been a lynching in Mississippi since 1955.
Certainly a formal apology is required from Congress, but this is a law in search of victims, and as such hardly a priority.
Reasonable people have much to consider and critique in Harris’s announced agenda. But it is apparent this will not be allowed to happen with some degree of freedom without being labelled a hater, racist and misogynist.
A President Harris would be a further descent into the maelstrom of racial and gender animus with the force of a presidency behind it.
Trump Campaign Reported Raising $21 Million, $19.2 Million Cash-on-Hand
Supporters of President Donald Trump hold up Make America Great American and Keep America Great signs A supporter of Donald Trump dons a T-shirt with a new twist on an old joke targeting Hillary Clinton during a rally in Tampa, Florida on Tuesday, July 31, 2018. (Photo: Laura Baris/People’s Pundit Daily)
The Trump Campaign raised over $21 million for the fourth quarter (Q4) 2018, with 98.5% coming from donations of $200 or less.
Fundraising totals for the quarterly report were submitted to the Federal Elections Commission (FEC) on Thursday. They reflect both direct contributions and contributions raised through its joint fundraising committees with the Republican National Committee (RNC).
“Midway through the first term of his presidency, President Donald Trump continues to deliver on his campaign promises to the American people and they continue to demonstrate their support for him in contributions to his reelection campaign,” Michael Glassner, Chief Operating Officer said in a statement.
“Significantly, grassroots support for the President has remained both steady and historic, with the vast majority of our fundraising coming from contributions of $200 or less.”
Despite losing control of the U.S. House of Representatives, while increasing the Republican majority in the U.S. Senate, the president’s campaign is poised to raise more money since taking the oath of office than he did as a first-time candidate.
The Trump Campaign closes out the calendar year with $19.2 million cash on hand (CoH).
“Low-dollar” contributions are indicative of grassroots enthusiasm and working-class support, one that is a clear and consistent trend for the campaign in 2018.
During the 2016 election, the then-Republican presidential candidate was a less-than prolific fundraiser juxtaposed to his opponent, Hillary Clinton. But he also spent far less time with bundlers than he did on the campaign trail.
In September 2016, the campaign announced raising a record $90 million in the heat of August, a personal record at the time but still far short of the $143 million haul for Mrs. Clinton.
That was and remains in large part due to the shift in big money politics in the era of President Trump. Though the securities and finance industry still hedges, Wall Street campaign contributions have shifted significantly over the last two cycles.
The securities and finance industry contributed $87,965,257 to Hillary Clinton, a stunning 80.8% of the total $108,807,888 given in two-party contributions.
That compares to the $20,842,631 contributed to then-Republican nominee Donald Trump, a paltry 19.2% of the total. The broader finance, insurance and real estate sector gave just $37,873,136 to President Trump, while they contributed a whopping $117,318,552 to Mrs. Clinton.
In 2018, the securities and finance industry donated more to Democrats than Republicans for the first time in a decade.
Democratic candidates and political action committees (PACs) received $57,144,009 in Wall Street campaign contributions, or 62.8% of the total $91,338,283. Republicans received $33,860,538, or 37.2% of total in donations from the securities and finance industry.
The broader sector of finance, insurance and real estate followed a similar pattern. In 2018, it contributed $150,087,616 to Democrats juxtaposed to $128,189,429 to Republicans.
Worth noting, spending by the Trump Campaign ramped up in Q4 2018 as the president went “all in” to defend Republican majorities in Congress ahead of the 2018 midterm elections.
For the prior three cycles, spending by the campaign averaged just over $5 million. For Q4, it exceeded $23 million. That includes expenditures on rallies, campaign ads, direct transfers to the RNC, and direct contributions to candidate committees.
In July 2018, the Trump Campaign and RNC transferred $8 million to the National Republican Senatorial Committee (NRSC) and the National Republican Congressional Committee (NRCC).
The Trump Campaign alone maxed out to nearly 100 candidates in its first round of contributions.
“This is a true testament to President Trump’s fulfillment of his promises made to the forgotten men and women of America,” Mr. Glassner added. “We’re grateful for their generous support of the Trump Campaign.”
A supporter of Donald Trump dons a T-shirt with a new twist on an old joke targeting Hillary Clinton during a rally in Tampa, Florida on Tuesday, July 31, 2018. (Photo: Laura Baris/People’s Pundit Daily)
Republican Governor Ron DeSantis announced Thursday in Cape Coral that he will sign an executive order eliminating Common Core in Florida, fulfilling a major campaign promise.
“One of the things we would constantly hear about on the campaign trail is frustration from parents with Common Core and the testing,” Governor DeSantis said.
Exit polls indicate the Republican as a candidate won upwards of 18% of the female black vote on the issue of education, specifically school choice.
Common Core standards cover mathematics, language arts and literacy from kindergarten to 12th grade. The new guidelines will aim to streamline standardization, and increase the literacy rate.
Forty-one other states had also adopted the standards by 2017, though they have been wildly unpopular in Florida and elsewhere.
“When you complained about Common Core, I heard you,” he said. “I told you I would do something about it, and today we’re acting to bring those promises into reality.”
The governor also announced at Tampa Bay Technical High School that he took executive action to make Florida the number one state in the nation for workforce education by 2030.
The Sunshine State is currently ranked 24th in the nation for people from ages 25 to 64 with an associate in arts degree or higher, or with a high-quality workforce relevant certificate.
On Thursday, Governor DeSantis also kicked off the start of “Deregathon” along with First Lady Casey DeSantis, Lieutenant Governor Jeanette Nuñez and Department of Business and Professional Regulation (DBPR) Secretary Halsey Beshears at Valencia College in Orlando.
The governor said he will work with the Florida Department of Education, as well as speak with teachers and parents about their experiences with Common Core.
“Let’s get this right,” Governor DeSantis added. “We want high quality, we want to demand excellence.”
UPDATE: Governor Ron DeSantis made the announcement reported by People’s Pundit Daily (PPD) on Twitter.
“Common Core has failed teachers, parents, and our children. That’s why I am issuing an Executive Order to eliminate Common Core in Florida,” he tweeted. “We will streamline standardized testing, make civics a priority in schools and increase the literacy rate.”
Common Core has failed teachers, parents, and our children. That’s why I am issuing an Executive Order to eliminate Common Core in Florida. We will streamline standardized testing, make civics a priority in schools and increase the literacy rate. pic.twitter.com/dp5mnabiit
My favorite annual publication from the Heritage Foundation, the Index of Economic Freedom, has just been released.
Like the Fraser Institute’s Economic Freedom of the World and, to a lesser extent, the World Economic Forum’s Global Competitiveness Report (U.S. #1 as of 2018), the Heritage Foundation survey is filled with interesting data on economic liberty in various nations.
We’ll start by sharing the global map. It’s good to be green, especially dark green. But it’s bad to be orange and even worse to be red.
Source: Heritage Foundation, the Index of Economic Freedom
Sadly, there are only six “free” jurisdictions.
Unsurprisingly, Hong Kong and Singapore are at the top, and I’m also not surprised to see New Zealand and Switzerland in the next two positions.
What’s especially impressive is that four of the six jurisdictions managed to increase their score.
Source: Heritage Foundation, the Index of Economic Freedom
Taiwan, meanwhile, deserves mention because it continues to slowly but surely improve – a process that hopefully won’t stop, thus allowing Taiwan to eventually converge with Hong Kong and Singapore.
Source: Heritage Foundation, the Index of Economic Freedom
Now let’s shift to the Baltic nations.
I’ve been a big fan of Estonia, Latvia, and Lithuania, but I’ve been worried about a recent drift in the wrong direction.
And that’s apparent in the Heritage data. This worries me since those countries should be further liberalizing and reforming to help counteract grim demographic trends.
Source: Heritage Foundation, the Index of Economic Freedom
By the way, I have similar concerns about Slovakia, though that nation’s drift in the wrong direction started several years sooner
Let’s close our discussion by looking at the unfortunate nations in the bottom category.
If you guessed the North Korea was the most repressed of the “repressed” nations, congratulations. It’s not just that it’s in last place, it wins that dubious distinction by a wide margin.
Source: Heritage Foundation, the Index of Economic Freedom
Though at least the North Koreans are trending in the right direction, albeit with an almost-too-small-to-measure improvement of just 0.1.
Cuba is #178 out of #180, yet still managed to go from absolutely awful to breathtakingly terrible with a -4.1 change in its score.
Speaking of awful and terrible, Venezuela is next to last. It remains even below Cuba, notwithstanding a small increase of 0.7.
Wages and salaries with keyboard graphic concept. (Photo: PPD/AdobeStock/Momius)
The Labor Department (DOL) via the Bureau of Labor Statistics (BLS) reported Thursday that wages and salaries in the fourth-quarter (Q4) 2018 posted the largest gain since Q3 2008.
The 3.1% increase, which was included in the Employment Cost Index that came in at 0.7%, is the first time in more than a decade that wages and salaries broke 3%.
The Federal Reserve closely watches the Employment Cost Index, which also found compensation costs for civilian workers rose 2.9% for the 12-month period ending December 2018.
Compensation costs for private industry workers increased 3.0% over the year compared to a 2.6% gain in 2017.
That compares with an already solid compensation costs gain of 2.6% in December 2017. Wages rose by 2.5% for the same 12-month period ending in 2017.
Benefit costs increased 2.8% for the 12-month period ending in December 2018. In December 2017, the increase was 2.5%.
Meanwhile, employer costs for health benefits increased 1.8% for the 12-month period ending December 2018.
Worth noting, the Bureau of Economic Analysis (BEA) was originally scheduled to release Personal Income and Outlays for December 2018 on Thursday (January 31). Due to the partial government shutdown, it has been delayed for a week.
You have %%pigeonMeterAvailable%% free %%pigeonCopyPage%% remaining this month. Get unlimited access and support reader-funded, independent data journalism.