Widget Image
Follow PPD Social Media
Tuesday, January 14, 2025
HomeStandard Blog Whole Post (Page 15)

The S&P CoreLogic Case-Shiller U.S. National Home Price NSA Index for all nine U.S. census divisions posted a 4.5% annual gain in May, down slightly from 4.6% in April. The 10-City Composite gained annually by 3.1%, down from 3.3% in the previous month. The 20-City Composite rose 3.7% year-over-year, after gaining 3.9% in April.

The S&P CoreLogic Case-Shiller 20-City Composite Home Price Index (HPI) SA (seasonally adjusted) were flat. Forecasts ranged from a low of 0.4% to a high of 0.5%.

“May’s housing price data were stable,” says Craig J. Lazzara, Managing Director and Global Head of Index Investment Strategy at S&P Dow Jones Indices. “The National Composite Index rose by 4.5% in May 2020, with comparable growth in the 10- and 20-City Composites (up 3.1% and 3.7%, respectively).”

Phoenix, Seattle and Tampa reported the highest year-over-year gains among the 19 cities in May, excluding Detroit. Phoenix led the way for the twelfth consecutive month with a 9.0% year-over-year price increase, followed by Seattle at 6.8% and Tampa at 6.0%. Three of the 19 cities reported higher price increases in the year ending May 2020 juxtaposed to the year ending April 2020.

“Among the cities, Phoenix retains the top spot for the 12th consecutive month, with a gain of 9.0% for May,” Mr. Lazzara added. “As has been the case for the last several months, prices were particularly strong in the West and Southeast, and comparatively weak in the Northeast.”

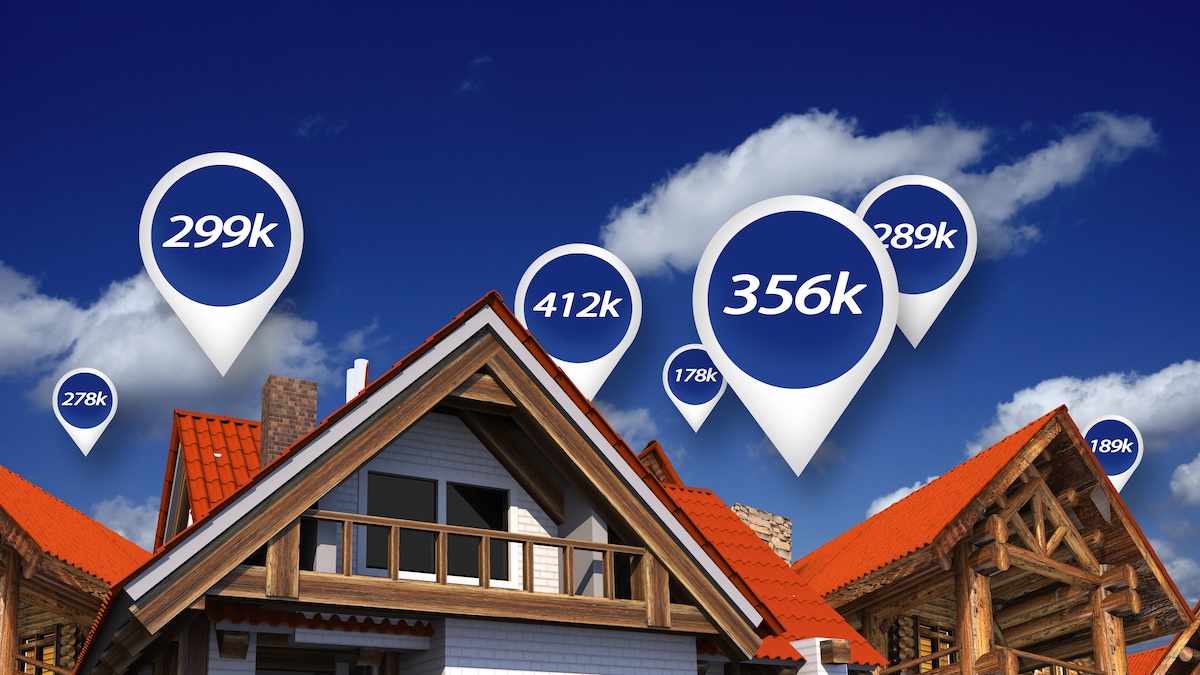
The S&P CoreLogic Case-Shiller U.S. National Home
Dallas, Tx. (PPD) — The Texas Manufacturing Outlook Survey inched even higher in July after soaring the month before from negative to positive territory. The Federal Reserve Bank of Dallas reported the key production index inched up higher from 13.6 to 16.1.

The general business activity index rose from -49.2 to -6.1 in June, and edged higher from -6.1 to -3.0 in July.

Dallas, Tx. (PPD) — The Texas Manufacturing

Watch Live 11:00 AM EST (PPD) — On Inside The Numbers, we discuss election fraud and provide analysis of the indicators on the economic calendar.

Subscribe on YouTube!

Like on Facebook

https://www.facebook.com/PeoplesPunditDaily

Follow on Twitter

https://twitter.com/Peoples_Pundit

https://twitter.com/PPDNews

Theme Song

“Bad Habit” By Grammy Considered Bowen Band

On Inside The Numbers, we discuss election

Manufacture of rails for trains and freight wagon, boxcars. Rail manufacturing plant. Stack of steel round bar - iron metal rail lines material for industry construction in warehouse. (Photo: AdobeStock)
Manufacture of rails for trains and freight wagon, boxcars. Rail manufacturing plant. Stack of steel round bar – iron metal rail lines material for industry construction in warehouse. (Photo: AdobeStock)

The U.S. Census Bureau reported new orders for manufactured durable goods gained 7.3%, or $14 billion to $206.9 billion in June. That’s the second straight month of strong data beating the consensus forecast.

Forecasts for new orders ranged from a low of 2.0% to a high of 12.0%. The consensus forecast was 6.5%, a still solid but less gain than the figure for June.

Excluding transportation, new orders for durable goods rose 3.3%. Forecasts ranged from a low of 2.0% to a high of 4.0%. The consensus forecast was 3.5%.

Excluding defense, new orders gained 9.2%. Transportation equipment, also up for the second consecutive month, led the gain, increasing $9.2 billion or 20.0% to $55.3 billion.

New orders for manufactured durable goods rose

New Residential Sales Crush Expectations, Show No Effects Due to COVID-19 in May and June

Washington, D.C. (PPD) — The U.S. Census Bureau and the U.S. Department of Housing and Urban Development (HUD) jointly reported the new residential sales statistics for May 2020. New home sales soared 13.8% (±17.8%) to a seasonally adjusted annual rate of 776,000 in June, easily beating the consensus forecast.

Forecasts ranged from a low of 645,000 to a high of 720,000. The consensus forecast was 700,000.

New residential sales were on fire prior to the pandemic and beginning to show the fourth cylinder firing in a strong economy, peaking at 774,000 in January. That’s the highest level for new home sales since before the Great Recession, or July 2007. If the figure for June holds, it would be the new high.

An exchange showing one hand giving cash to the another for new house and keys, a vector illustration for new home sales. (Photo: AdobeStock)

The month of May was revised up from 672,000 to a rate of 682,000, despite the coronavirus (COVID-19) impact when most businesses and government were operating on a limited capacity or had ceased operations totally. Still, new home sales have shown little impact due to the pandemic and are now 6.9% (±13.7%) higher than the June 2019 estimate of 726,000.

The median sales price of new houses sold in June 2020 was $329,200. The average sales price was $384,700. The seasonally-adjusted estimate of new houses for sale at the end of June was 307,000, representing a supply of 4.7 months at the current sales rate.

Washington, D.C. — New home sales soared

Watch Live 10:00 AM EST (PPD) — On Inside The Numbers, the People’s Pundit returns to discuss brand new polls and to provide political and economic analysis.

Subscribe on YouTube!

Like on Facebook

https://www.facebook.com/PeoplesPunditDaily

Follow on Twitter

https://twitter.com/Peoples_Pundit

https://twitter.com/PPDNews

Theme Song

“Bad Habit” By Grammy Considered Bowen Band

On Inside The Numbers, the People's Pundit

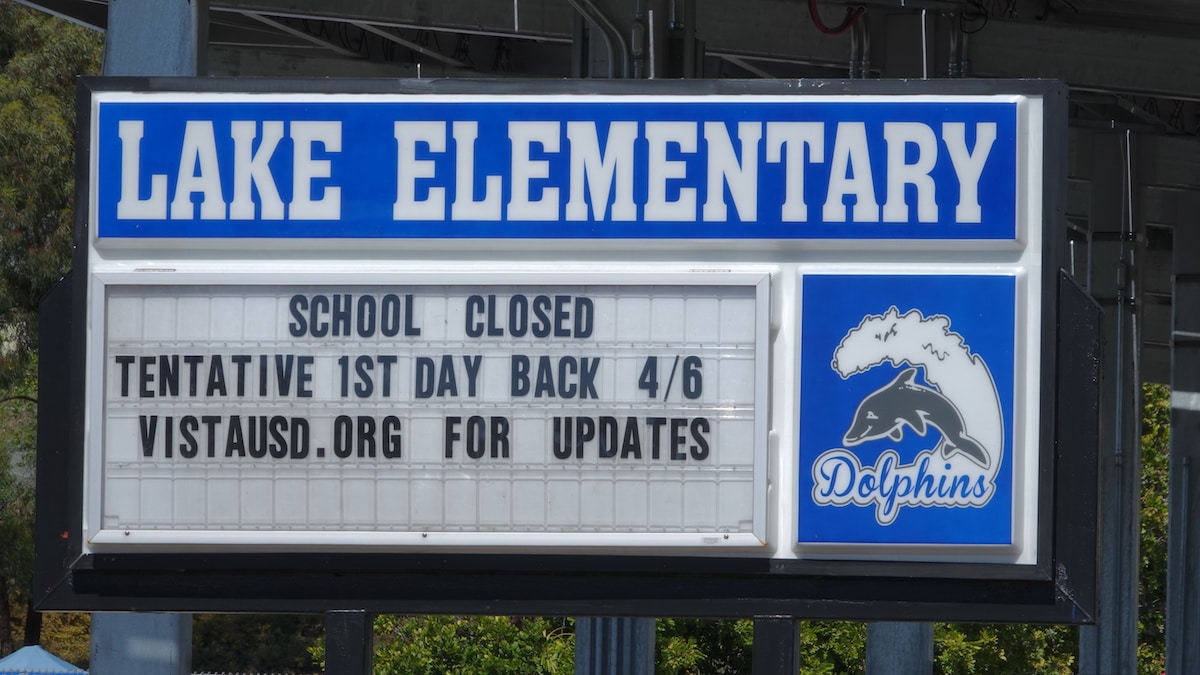
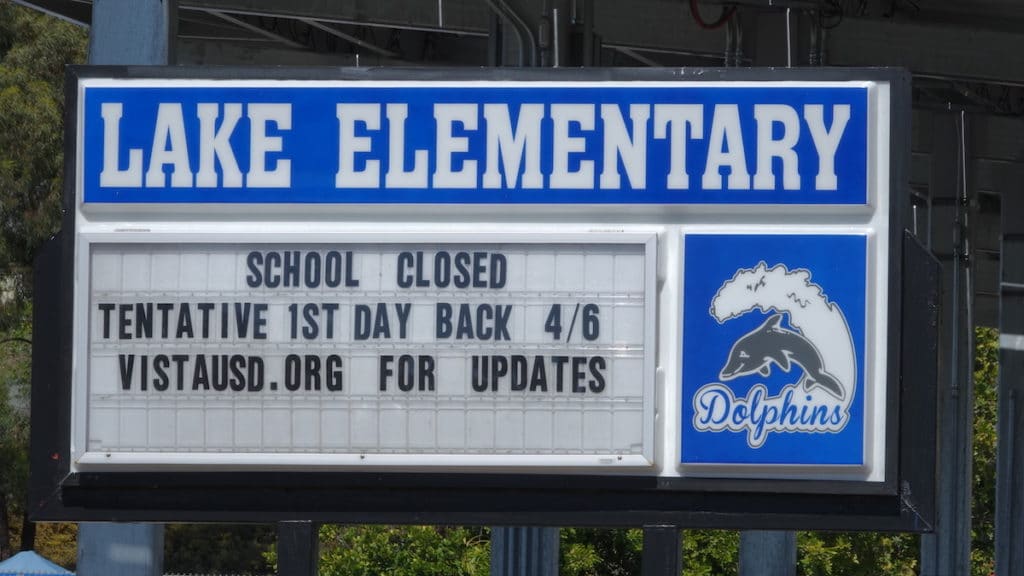
Vista, CA / USA - March 17, 2020: Sign at Lake Elementary School in San Diego alerting school closed due to the coronavirus (COVID-19). (Photo: AdobeStock)
Vista, CA / USA – March 17, 2020: Sign at Lake Elementary School in San Diego alerting school closed due to the coronavirus (COVID-19). (Photo: AdobeStock)

Asbury Park, N.J. (PPD) — Most parents who have school-age children want schools to reopen in the fall, a new survey finds. A Rasmussen Reports telephone and online survey finds 57% of adults who have kids in elementary or secondary schools believe schools in their community should reopen.

Thirty-two percent (32%) disagree and 11% are undecided.

Meanwhile, 52% of these adults think it will be bad for students if the schools do not reopen this fall, and only 31% say it will be good for the students. Six percent (6%) say it will have no impact if schools remain closed and 11% are unsure.

Further, 46% of adults with school-age children believe online stay-at-home learning does not work for most students, while 38% disagree and say it does. Seventeen percent (17%) are undecided.

Among all American adults, 41% think schools should reopen and 39% do not, while 20% are unsure. Fifty-four percent (54%) think it will be bad for the students if the schools do not reopen. Only 23% say it will be good for the students, while 10% say it will have no impact.

As People’s Pundit Daily (PPD) previously reported, research at University College London (UCL) suggests school closures do little to mitigate the spread of coronavirus (COVID-19). Further, researchers warn about the negative consequences due to prolonged school closures, a warning now echoed by the American Academy of Pediatrics (AAP).

“Schools are fundamental to child and adolescent development and well-being and provide our children and adolescents with academic instruction, social and emotional skills, safety, reliable nutrition, physical/speech and mental health therapy, and opportunities for physical activity, among other benefits,” AAP wrote in their guidance and recommendations. “Beyond supporting the educational development of children and adolescents, schools play a critical role in addressing racial and social inequity.”

The survey of 1,000 American Adults was conducted July 19-20, 2020 by Rasmussen Reports. The margin of sampling error is +/- 3 percentage points with a 95% level of confidence.

Most parents who have elementary or secondary

Washington, D.C. (PPD) — The U.S. Labor Department (DOL) reported initial jobless claims ticked higher to 1,416,000 for the week ending July 18, an increase of 109,000. The previous week was upwardly revised (7,000) to 1,307,000.

The 4-week moving average came in at 1,360,250, a decrease of 16,500. The previous week’s average was revised up by 1,750 from 1,375,000 to 1,376,750.

More than 50 million Americans had at some point filed initial claims for unemployment benefits as a result of the “shutdown” to slow the spread of coronavirus (COVID-19). The Small Business Administration (SBA) reported the Paycheck Protection Program (PPP) saved more than 50 million jobs. With small businesses employing 59.9 million across the country, that represents upwards of 84% of all their employees.

While tens of millions now have returned to work given monthly employment situation statistics and lagging data, the increase is the result of repeated attempts to pause reopening the economy.

Lagging Jobless Claims Data

U.S. initial jobless claims graph on a tablet screen. (Photo: AdobeStock)

The advance seasonally adjusted insured unemployment rate was 11.1% for the week ending July 11, down 0.7% from the previous week’s downwardly revised rate, which was revised down by 0.1 from 11.9 to 11.8%.

The advance number for seasonally adjusted insured unemployment during the week ending July 11 came in at 16,197,000, a decline of 1,107,000. The previous week’s level was revised down by 34,000 from 17,338,000 to 17,304,000.

The 4-week moving average was 17,505,250, a decline of 758,500. The previous week’s average was revised down by 8,500 from 18,272,250 to 18,263,750.

The highest insured unemployment rates in the week ending July 4 were in Puerto Rico (26.0), Nevada (21.3), Hawaii (20.7), Georgia (18.0), California (16.9), Louisiana (16.6), New York (16.1), Connecticut (15.4), the Virgin Islands (15.2), and Massachusetts (15.0).

The largest increases in initial claims for the week ending July 11 were in Florida (+65,890), Georgia (+33,292), California (+20,123), Washington (+16,116), and Indiana (+6,258), while the largest decreases were in Maryland (-13,728), Texas (-11,583), New Jersey (-8,577), Michigan (-6,882), and Louisiana (-5,066).

The U.S. Labor Department (DOL) reported initial

Washington, D.C. – The Federal Housing Finance Agency (FHFA) House Price Index (HPI) fell 0.3% in May, though house prices rose 4.9% year-over-year. The previously reported 0.2% increase for April 2020 was revised downward to 0.1%.

For the nine census divisions, seasonally adjusted monthly house price changes from April 2020 to May 2020 ranged from -1.0% in the New England division to +0.1% in the South Atlantic division.  The 12-month changes were all positive, ranging from +3.7% in the New England division to +6.3% in the Mountain division.

“U.S. house prices posted a small decrease in May compared to April but remained 4.9% higher than a year ago,” according to Dr. Lynn Fisher, Deputy Director of the Division of Research and Statistics at FHFA. “The May HPI results are based on contracts for sale signed in late March and throughout April, which was a period when many states announced stay-at-home orders.”

The next HPI report will be released August 25, 2020 with data for the second quarter of 2020 and monthly data through June 2020.

“The number of transactions powering the FHFA HPI in May was down by just over 30 percent compared to a year ago, reflecting the early effects of COVID-19 shutdowns,” Dr. Fisher added. “Based on the rebound in mortgage applications for home purchases and pending home sales in May, we expect the number of transactions increased somewhat in June.”

The Federal Housing Finance Agency (FHFA) House

File photo: A sold sign on an existing home. (Photo: AdobeStock)

Washington, D.C. (PPD) — The National Association of Realtors (NAR) reported existing home sales rebounded at a record 20.7% gain in June after three straight months of declines.

Total existing-home sales — completed transactions that include single-family homes, townhomes, condominiums and co-ops — rose to a seasonally-adjusted annual rate of 4.72 million in June. However, year-over-year sales are still down 11.3% from a year ago (5.32 million in June 2019).

“The sales recovery is strong, as buyers were eager to purchase homes and properties that they had been eyeing during the shutdown,” Lawrence Yun, chief economist at NAR said. “This revitalization looks to be sustainable for many months ahead as long as mortgage rates remain low and job gains continue.”

The median existing home price for all housing types in June came in at $295,300, up 3.5% from June 2019 ($285,400). Prices rose in every region and the increase marks 100 straight months of year-over-year gains.

Total housing inventory at the end of June totaled 1.57 million units, up 1.3% from May. But that’s still down 18.2% from one year ago (1.92 million). Unsold inventory sits at a 4.0-month supply at the current sales pace, down from both 4.8 months in May and from the 4.3-month figure recorded in June 2019.

“Home prices rose during the lockdown and could rise even further due to heavy buyer competition and a significant shortage of supply,” Mr. Yun added.

Regional Existing Home Sales

Sales in June increased in every region after falling in all back in May. Median home prices grew in each of the four major regions from one year ago.

In the Northeast, existing home sales rose 4.3%, recording an annual rate of 490,000, a 27.9% decrease from a year ago. The median price in the Northeast was $332,900, up 3.6% from June 2019.

Existing home sales in the Midwest gained 11.1% to an annual rate of 1,100,000, down 13.4% from a year ago. The median price in the Midwest was $236,900, a 3.2% increase from June 2019.

In the South, existing home sales soared 26.0% to an annual rate of 2.18 million in June, down 4.0% from the same time one year ago. The median price in the South was $258,500, a 4.4% increase from a year ago.

Existing home sales in the West skyrocketed 31.9% to an annual rate of 950,000 in June, a 13.6% decline from a year ago. The median price in the West was $432,600, up 5.4% from June 2019.

The National Association of Realtors (NAR) reported

People's Pundit Daily
You have %%pigeonMeterAvailable%% free %%pigeonCopyPage%% remaining this month. Get unlimited access and support reader-funded, independent data journalism.

Start a 14-day free trial now. Pay later!

Start Trial