Widget Image
Follow PPD Social Media
Tuesday, January 28, 2025
HomeStandard Blog Whole Post (Page 154)

Voting, elections and state polls concept: Ballot box with state flag in the background - Arizona. (Photo: AdobeStock)

Voting, elections and state polls concept: Ballot box with state flag in the background – Arizona. (Photo: AdobeStock)

The U.S. Senate election projection in Arizona held at Slightly Republican in favor of Rep. Martha McSally on the PPD Election Projection Model. Democratic Rep. Kyrsten Sinema would need to win the independent and Election Day vote by overwhelming margins in order to prevail.

There are roughly 3.7 million registered voters in Arizona.

Of the 1,586,783 voters who have already cast their ballots, 656,822 are Republican ballots, 538,174 are Democratic ballots, 11,799 are minor parties and 379,988 are independents, or other. Below is a district-by-district table breakdown of the early vote by party, including the secretary of state update for Monday.

[su_table responsive=”yes” class=”az-ev-district-party-totals”]

District Democrat Minor Republican Other Total Edge
1 57161 969 61840 36247 156217 R+4679
2 83046 1570 72147 48146 204909 D+10899
3 56319 946 30696 25366 113327 D+25623
4 40888 1094 100622 47129 189733 R+59734
5 55596 1661 105508 52362 215127 R+49912
6 64102 1656 101918 54794 222470 R+37816
7 49955 818 17378 20027 88178 D+32577
8 61378 1370 106367 54105 223220 R+44989
9 69729 1715 60346 41812 173602 D+9383
Total 538174 11799 656822 379988 1586783 R+118648

[/su_table]

There is no doubt both parties got their bases to the polls for midterms. For the purpose of this article we are focusing on the statewide impact, but the impact can be seen in the districts, as well.

The pickup opportunity for Democrats in Rep. McSally’s district could very well be offset by a net pickup for the GOP in Arizona’s 1st Congressional District. Again, as with so many of these races, the independents will decide the outcome. Here is the county-by-county table breakdown of the early vote by party.

[su_table responsive=”yes” class=”az-ev-county-party-totals”]

County Democrat Minor Republican OTH Total Edge
Apache 4310 33 2564 1477 8384 D+1750
Cochise 8740 195 12158 6656 27749 R+3418
Coconino 13862 307 9077 7300 30546 D+4785
Gila 4217 76 7670 2887 14850 R+3453
Graham 1714 25 3414 904 6057 R+1700
Greenlee 784 12 538 266 1600 D+246
La Paz 583 15 1562 731 2891 R+979
Maricopa 319709 7645 413398 236538 977290 R+93689
Mohave 8078 168 23695 10147 42088 R+15617
Navajo 6075 96 8791 3633 18595 R+2716
Pima 116340 2061 88060 62393 268854 D+28280
Pinal 20780 439 30642 18015 69876 R+9862
Santa Cruz 4373 50 1603 1560 7586 D+2770
Yavapai 18922 506 41749 20773 81950 R+22827
Yuma 9687 171 11901 6708 28467 R+2214
Total 538174 11799 656822 379988 1586783 R+118648

[/su_table]

Polls are all over the place. Our data indicates the independent vote, once breaking heavily for Rep. Sinema, shifted considerably. In truth, we’ve seen independents in Arizona flirt with the idea of voting for Democratic candidates statewide, only to swing back in the final stretch.

Rep. Sinema not only needs to carry a bloc of voters who haven’t backed a Democrat since 2008, when Barack Obama won them by just 51% to 46%, but she’ll need to do it by a huge margin. It would be historic.

(Please note: Estimates peg early vote in Arizona upwards of 80% before Election Day. This number is of course unknown and why we model several turnout different outcomes.)

In order to simply pull to a statistical tie, she would need to be winning both the unaffiliated “other” and minor-party vote by a margin roughly in the 2-to-1 ballpark. Again, some polling suggests it is possible, and some polling does not.

How does this task match up to the historic vote? Politics is filled with first-timers, but it’s not been done by a modern Democrat in the state of Arizona.

Mr. Obama went on to lose independents in Arizona to Mitt Romney by nearly the same margin he had previously carried them against John McCain, 51% to 45%. Donald Trump carried independents in Arizona, 47% to 44%, while outgoing Republican Senator Jeff Flake won them by just 46% to 45%.

But for Rep. Sinema to overcome the R+118,648 early vote lead, up from R+116,009 before the Monday update, she would first need a historic margin no Democrat has received among independents in the Grand Canyon State. Further, considering what vote is left on the table, she will also need a monster Election Day turnout that favors Democrats.

Judging by the data, which include what electorate is showing up, there’s not much evidence outside of some polls indicating she’ll get enough. That being said, polling also indicates Rep. McSally has a larger share of the vote left on the table. Rep. Sinema will almost certainly need every vote she can get.

While Green Party candidate Angela Green withdrew from the race in a last-minute attempt to boost Rep. Sinema’s chances, some of the state’s 6,463 registered members undoubtedly already voted for Green, whose name will remain on the ballot. That would actually expand the model’s required margin among independents for the Democratic candidate, given polling data indicates single-digit crossover rates only slightly favoring Rep. Sinema.

Before the update on Monday, which gave Rep. Sinema a nice few thousand-vote boost in Pima County, the electorate looked like this.

[su_table responsive=”yes” class=”az-ev-electorate-totals”]

Republican Democrat Other Female Median Age Mean Age
41.8% 33.9% 23.6% 51.2% 62 58.7
Republican 48.5% 63 61.3
Democrat 57.5% 61 57.2
Other 47.4% 59 56.6
Libertarian 33.7% 45 46
Green 43.5% 46 46.9

[/su_table]

After the update on Monday, the electorate shifted slightly in favor of Rep. Sinema, though it’s only marginally better for Democrats. It’s worth noting that a popular GOP governor running away with the vote is also on the same ballot. Even the slightest of coattails in a race like this could mean an earlier call.

[su_table responsive=”yes” class=”az-ev-electorate-totals”]

Republican Democrat Other Female Median Age Mean Age
41.4% 33.9% 23.9% 51.3% 61 58.2
Republican 48.5% 63 60.9
Democrat 57.7% 60 56.2
Other 47.6% 59 56
Libertarian 33.7% 44 45.5
Green 43.9% 45 46.5

[/su_table]

Regardless, Rep. McSally’s edge wasn’t hurt all that much in the latest update. The net partisan ballot edge gained even as the mean age ticked down by 0.5% and the Republican share of the electorate ticked down slightly to 41.4%. That may have something to do with the mean age of the Republican electorate also ticking down by 0.4%.

Overall, the Republican share of the vote is still nearly double what it was in 2016.

While we hear talk of a surge in younger voters at the polls, as we pointed out in our last model update in Nevada, these comparisons have focused on 2014. As with Nevada, there were not comparable statewide elections held.

So, to sum it up, we do believe it is possible for Rep. Sinema to improve her party’s margin among independent voters in Arizona, particularly if it is more educated and less rural. But the historical odds are against this. Republicans are voting at very high rates and have showed no signs up letting up. Recent polling indicates as much as 30% of Rep. McSally’s vote is still on the table, while just 10% for Rep. Sinema.

We will watch the electorate closely and the independent vote. But for now, the U.S. Senate election projection in Arizona remains Slightly Republican. Rep. McSally prevails in the high Republican turnout model, the base model and only loses by under two points in the high Democratic turnout model.

The U.S. Senate election projection in Arizona

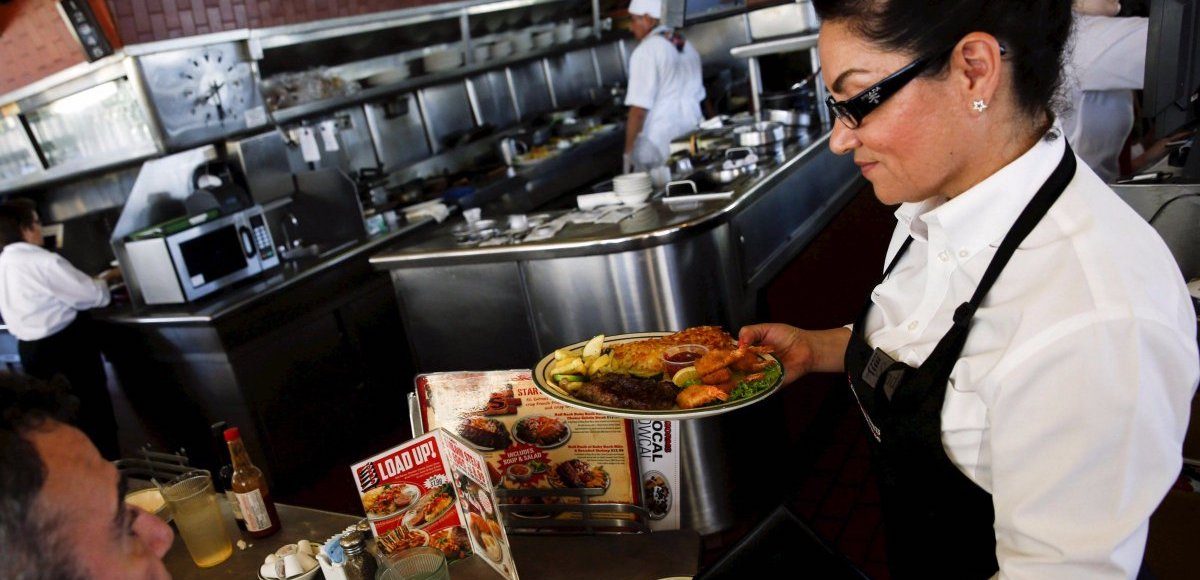
A waitress serves a steak and fried shrimp combo plate to a customer at Norms Diner on La Cienega Boulevard in Los Angeles, California May 20, 2015. (Photo: Reuters)

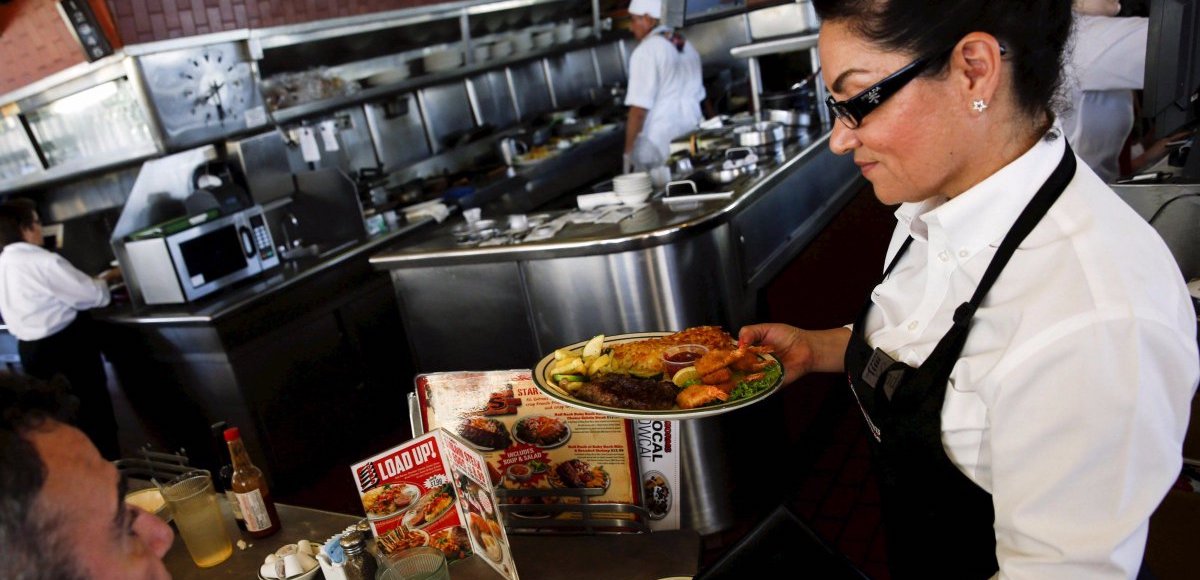
A waitress serves a steak and fried shrimp combo plate to a customer at Norms Diner on La Cienega Boulevard in Los Angeles, California May 20, 2015. (Photo: Reuters)

The Institute for Supply Management (ISM) Non-Manufacturing Index (NMI) came in at 60.3%, a slighter than expected decline from elevated levels. The consensus forecast called for 59.1, with forecasts ranging from 56.0 to 61.2.

“The non-manufacturing sector has again reflected strong growth despite a slight cooling off after a record month in September,” Anthony Nieves, Chair of the ISM Non-Manufacturing Business Survey Committee. “There are continued concerns about capacity, logistics and tariffs. The respondents are positive about current business conditions and the economy.”

The Non-Manufacturing Business Activity Index decreased to 62.5%, 2.7 percentage points lower than the September reading of 65.2%. That still reflects growth for the 111th consecutive month, albeit at a slower but still red hot rate in October.

The New Orders Index only eased marginally at 61.5%, or 0.1 percentage point from the reading of 61.6% in September. The Employment Index, which was also elevated, fell 2.7 percentage points in October to 59.7% from the September reading of 62.4%.

The Prices Index actually fell despite tariff concerns, decling 2.5 percentage points from the September reading of 64.2% to 61.7%, indicating that prices increased in October for the 32nd consecutive month.

According to the NMI, 17 non-manufacturing industries reported growth.

Those 17 non-manufacturing industries reporting growth in October — listed in order — are: Real Estate, Rental & Leasing; Information; Transportation & Warehousing; Utilities; Arts, Entertainment & Recreation; Professional, Scientific & Technical Services; Construction; Health Care & Social Assistance; Management of Companies & Support Services; Wholesale Trade; Public Administration; Agriculture, Forestry, Fishing & Hunting; Accommodation & Food Services; Mining; Finance & Insurance; Retail Trade; and Other Services.

The only industry reporting a decrease in October was Educational Services.

The Institute for Supply Management (ISM) Non-Manufacturing

A downtrend depicts the graphic concept of market volatility. (Photo: AdobeStock)

A downtrend depicts the graphic concept of market volatility. (Photo: AdobeStock)

Stocks began the first 2 days of November right where they left off October, with big intraday swings on the Market Averages, and a very weak technology sector leading the downside action.

On Friday, despite a very impressive October Jobs report, a sharply higher opening failed to hold, as disappointing earnings from Apple Inc (^AAPL), and a volley of comments that tempered optimism on China trade talks were too much for stocks to extend their rebound rally from the prior 3 days.

The recent theme of Social Media and Internet Content Delivery companies bearing the brunt of the selling was in full force Friday, as investors continue to have zero tolerance for sloppy earnings reports, or top line revenue shortfalls.

Companies with triple digit valuations and/or those with outsized gains year to date are particularly vulnerable, as investors continue to de risk within the Equity Asset Class. In the case of Apple Inc (^AAPL), some were particularly irked by their decision to discontinue monthly sales metrics on individual product lines.

There were positives to take from both Fridays fail and the entire week. We did have net gains on the week for major market averages ranging from +2.4% for both the DJIA and S&P 500 to +4.4% for the Russell 2000.

While the S&P 500 (^SPX); 2723 -0.6%, had a 2% swing from high to low, it rallied off the 2700 benchmark at the lows after failing to get through near term technical resistance at the 2750 – 2760 level. The 200 day moving average is at 2765 and the S&P 500 has only closed more than fractionally above it twice since October 10.

Keep an eye on those near term support and resistance levels this week.

The lows last week held well above the really ugly lows from the prior week on both an intraday and closing basis. Given the 3 to 5 days of high volume that accompanied those lows, the longer they hold on any further market selloffs, the more investors will gain confidence that those lows will hold through year end.

The Advance/Decline stats were also encouraging on Friday as the broad market outperformed the market averages. Declining issues trailed advancers by slightly less than 3 to 2 at the NYSE, and despite the sharp selloff in high profile technology names, it didn’t spillover to the rank and file of the 3000 stock NASDAQ universe as advancing issues actually beat decliners by 100 issues.

On a day where the NASDAQ Composite (^IXIC) was -1%, and the even more tech centric NASDAQ 100 (^IXNDX ) -1.5%, the adv/decl stats are a positive divergence that we will watch closely this week.

Finally, the calendar may benefit investors this week. With the Midterm Elections tomorrow, equity markets may get some relief that regardless of the outcome in the House of Representatives, the uncertainty will be lifted.

Additionally, the market has felt at times over the last few weeks that it was responding to the ebb and flow, or more appropriately the roller coaster anxiety swings regarding the Midterm outcome. Typically, I dislike mixing political and market forecasting, but it’s obviously the Elephant in the room so here’s my view:

The Republicans will gain 3 to 5 seats in the Senate. That’s the easy part, and it will be closer to 5 than 3.

The House of Representatives is very tricky, but I have a very contrarian forecast from the narrative that most political pundits have united around. There has been a meaningful shift in sentiment over the last 3 to 5 days that has gone largely undetected that will aid in the Republicans holding their majority in the House, albeit with a much narrower margin than they currently have. When the dust settles their margin somewhere between 220 – 215 and 225 – 210.

I’m not just throwing darts. There is a massive ABC – Washington Post survey/poll that hit over the weekend. It’s a 25 question multi-tab survey of over 1,000 registered voters, broken down by every demographic imaginable. Here’s the key takeaway: The Generic Poll gives the Democrats a 7-point advantage. That margin is NOT enough to flip the House.

Additionally, inside the detail there is one critical metric.

Among independent women (by party affiliation) the advantage to the Democrats is +2……that margin among independent women was +30 a week ago. That is not a typo! Party preference by independent women in the Generic Poll declined from Democrat +30 to Democrat+2 in 1 week. The margin among women was a major part of the narrative supporting the Democrats taking control of the House and it has evaporated.

Stocks began November right where they left

The Millennial Generation is the worst educated generation to come along in many years, mainly because they are more interested in other people’s thoughts, rather than their own.

Liberty Never Sleeps Banner

*Show Updates Rolling Out
*Millennials Don’t Vote
*Wired in and Tuned Out
*Misinformed and Miseducated
*Everyone Wins, Everyone Loses

Today’s Bumper Music provided in connection with Blue Dot Sessions from Freemusic.org.

Closing Music
http://www.hulkshare.com/praktikos/dark-nights-rise

The money pledged thru Patreon.com will go toward show costs such as advertising, server time, and broadcasting equipment. If we can get enough listeners, we will expand the show to two hours and hire additional staff.

To help our show out, please support us on Patreon: https://www.patreon.com/LibertyNeverSleeps

All bumper music and sound clips are not owned by the show, are commentary, and of educational purposes, or de minimus effect, and not for monetary gain.

No copyright is claimed in any use of such materials and to the extent that material may appear to be infringed, I assert that such alleged infringement is permissible under fair use principles in U.S. copyright laws. If you believe material has been used in an unauthorized manner, please contact the poster.

Tom discusses how the Millennial Generation was

Voting, elections and state polls concept: Ballot box with state flag in the background - Nevada. (Photo: AdobeStock)

Voting, elections and state polls concept: Ballot box with state flag in the background – Nevada. (Photo: AdobeStock)

Early voting in The Silver State has ended and the projection model shows the U.S. Senate election in Nevada remains a true battleground. Much of the media analysis of the race has focused on comparisons to the 2014 midterms, a low-turnout cycle in which no election for U.S. Senate was held statewide.

Our analysis has found 2012 and 2016 more comparable and, even still, we find ourselves right back where we started: it’s all about the independent vote.

Incumbent Senator Dean Heller, R-Nev., who is one of the best retail politicians in the country, will need a margin among independent voters that Democratic candidates are hoping for in other states and districts across the country.

And yet, it’s very doable because it’s a margin that very much mirrors Senator Heller’s historic vote share among this key group in a state where it’s needed to offset a slightly more Democratic partisan lean.

Here’s what it boils down to.

As in many other states, beginning with North Dakota, the controversy over the confirmation of Associate Justice Brett Kavanaugh to the U.S. Supreme Court significantly reduced the potential for moderate Republican women to become a rich crossover target demographic.

That being said, the state and closeness of the race can be underscored with a brief and simple demonstration. Let’s first take a look at the early vote.

[su_table responsive=”yes”]

Party In-Person Early Absentee Ballots Mail-Ins Total
Democrat 233,061 26,740 626 260,427
Percent 42.06% 37.49% 21.28%
Republican 204,930 31,521 1,684 238,135
Percent 36.99% 44.19% 57.24%
Other 116,083 13,065 632 130,381
Percent 20.95% 18.32% 21.48%
Edge D+28,131 R+4,781 R+1,058 D+22,292

[/su_table]

Republicans have generally carried the non-party affiliated independent vote in Nevada for several straight cycles. But along with base turnout, the margin among independents decided the ultimate outcome.

President Donald Trump lost Nevada to Hillary Clinton in 2016 by 2.4 points, 47.9% to 45.5%. But he won the independent vote by a large margin, 53% to 37%. Democratic Senator Catherine Cortez Masto defeated Republican Joe Heck 47.1% to 44.7%.

Mr. Heck won 16 out of the state’s 17 counties and equivalents, while Senator Cortez Masto won only Clark County, which comprises over 70% of the state’s population. He also only carried the independent vote by a 10-point margin, 49% to 39%.

That wasn’t enough.

In 2012, soon-to-be “Senator” Mitt Romney only won them by 7 points, or 50% to 43%, and lost to Barack Obama, 52.36% to 45.68%. But Senator Heller won them by 20 points, 53% to 33%, and was able to hang on that same cycle, 45.9% to 44.7%.

Let’s see what happens when we assume Democratic challenger Jacky Rosen earns a historical share of the independent vote. If we just look at the early vote numbers above and do some basic math, we can see how tight this race really is. We’ll assume a 90% base turnout for each candidate and exclude third-party candidates for simplicity.

Give historic voting patterns, we can also assume 90% of the independent vote will be distributed between the two-party candidates, while roughly 10% will go to third-party candidates. We can’t allocate base crossover in this exercise because it will not be distributed at the same rate only between two-party candidates.

While we should note this hurts Senator Heller in our exercise — simply because there are more Democrats than Republicans in Nevada — base loss does benefit third-party candidates and we’re trying for simplicity here.

[su_table responsive=”yes”]

Vote Rosen (D) Heller (R) Difference
90% Base 234,384 214,322 Rosen+20,144
Independent 48,241 69,102 Heller+20,861
Total Votes 282,625 283,424 Heller+799

[/su_table]

(Update: Please note an adjustment of the official totals was made and is now reflected in the above tables. The revisions increased the above result from Heller+717 to Heller+799.)

As you can see, it’s going to be a tough call for the election projection model.

While it’s certainly true that Democrats came out during the last day of in-person early voting in Clark County on Friday, they fell short of the model’s projected 50,000. Traditionally, the Republican vote in Nevada is heavier on Election Day, which bodes well for Senator Heller.

But Democrats still have a lot of votes on the table and, ultimately, as you can see above from our little exercise, it’s the independents who likely will have the final say. Both parties have done a good job getting their base out in a midterm. But the comparisons to 2014 are a trap. Team Heller must feel much better today than they did in 2012, when he went into Election Day with an early vote deficit more than double the size they face this cycle.

The PPD Senate Election Projection Model continues to project the U.S. Senate election in Nevada a Battleground.

For more on the early vote in Nevada, view the PDF below. It’ll be updated as it is updated.

[su_document url=”https://www.peoplespunditdaily.com/wp-content/uploads/2018/11/2018-General-Election-Early-Vote-Turnout-Nevada.pdf” width=”720″ height=”860″]

Early voting in The Silver State has

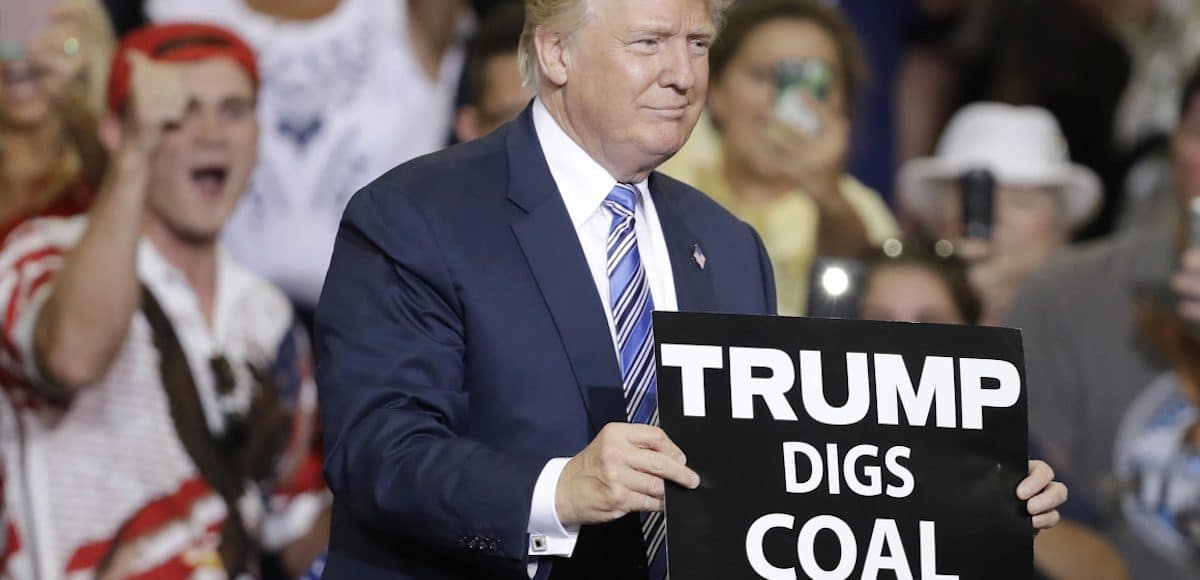
Donald Trump holds up a "Trump Digs Coal" placard at a rally promising to bring back the coal industry in West Virginia, Ohio and elsewhere.

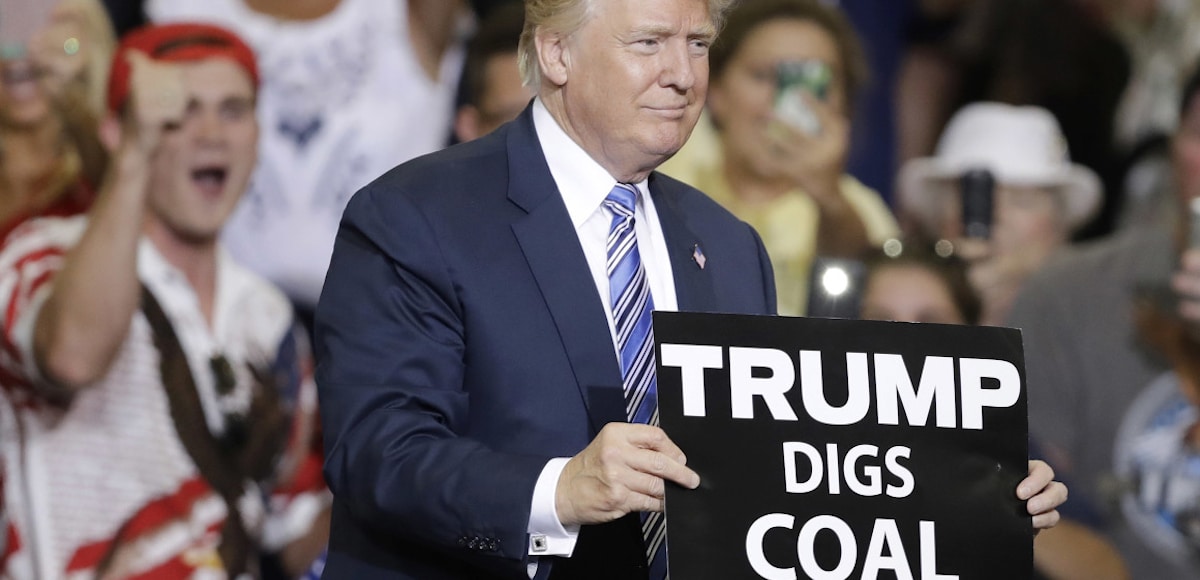
Donald Trump holds up a “Trump Digs Coal” placard at a rally promising to bring back the coal industry in West Virginia, Ohio and elsewhere.

President Donald Trump is touting the booming economy after a strong jobs report as he barnstorms the country ahead of the 2018 midterms. On Friday, the president was in Missouri and Indiana to campaign for Republicans Josh Hawley and Mike Braun, respectively.

“We are finally putting America first,” President Trump said in Indiana, alongside Vice President Mike Pence and beloved former NCAA Indiana University basketball coach Bobby Knight. “But if they get power, they will try to erase our gains and eradicate our progress.”

Also on Friday, the Labor Department (DOL) via the Bureau of Labor Statistics (BLS) reported the U.S. economy in October added 250,000 jobs, labor participation ticked up, wages rose at the fastest rate since 2009 and unemployment remained at 3.7%, the lowest rate since 1969.

President Trump and Republicans want to make the election about the economy and immigration, while Democrats are trying to make it about him and healthcare. While Republicans failed to repeal ObamaCare, or make good on a 7-year promise to voters, premiums for the benchmark silver plan, the most popular plan on the federally-run exchanges, saw average premium decreases for the first time since the law was fully implemented in 2014.

The Bureau of Economic Analysis (BEA) reported the U.S. economy is on track to grow at an annual rate of 3% or greater for the first time since 2005. The advance estimate for third-quarter (Q3) gross domestic product (GDP) came in at 3.5%.

Heading into the final two-week stretch, the campaign said the president was “all-in” to ensure Republicans maintain control of the U.S. House and expand their majorities in the U.S. Senate. The president put the party on his back in an attempt to juice GOP turnout enough to defy history.

President Trump has nearly 30 rallies since July 5 and is slated to spend $20 million campaigning for Republican candidates nationwide. He’ll end the tour on Election Night in Missouri, where Republicans are currently projected to defeat incumbent Democratic Senator Claire McCaskill.

The longtime Clinton ally is facing the most difficult reelection challenge of her career.

In Indiana, incumbent Senator Joe Donnelly, D-Ind., is hoping the presence of a third-party libertarian candidate will siphon enough votes from Mr. Braun to allow him to eke out a win. But the president told the crowd of enthusiastic voters at Southport High School that there is only one choice if they want the country to continue to move forward.

“If you want prosperity for your family, safety for your children and security for your country, vote for Mike Braun,” he said.

President Donald Trump is touting the booming

An American Flag flying in front of a U.S. manufacturing factory. (Photo: AdobeStock)

An American Flag flying in front of a U.S. manufacturing factory. (Photo: AdobeStock)

The U.S. Census Bureau via the Commerce Department reported factory orders in the U.S. came in better than expectations in September and posted an upward revision to a big gain in August.

New orders for manufactured goods in September, which have been up four of the last five months, rose $3.4 billion or 0.7% to $515.3 billion.  This followed a 2.6% August increase, which was revised up from an already very solid 2.3%.

Shipments, up 16 of the last 17 months, rose $4.6 billion or 0.9% to $509.8 billion.  This followed a 0.7% August increase.  Unfilled orders, up 10 of the last 11 months, increased $9.7 billion or 0.8% to $1,186.5 billion.  This followed a 0.9% August increase.

The unfilled orders‐to‐shipments ratio was 6.64, down from 6.67 in August.

Inventories, up twenty‐three consecutive months, increased $3.7 billion or 0.5% to $680.4 billion.  This followed a 0.1% August increase.  The inventories‐to‐shipments ratio was 1.33, down from 1.34 in August.

Worth noting, the Employment Situation, or monthly jobs report, shows the manufacturing sector gaining another 32,000 jobs in October and 296,000 jobs over the year, largely in durable goods. This represents a total reversal in trend from the previous administration, when the sector was on life support.

Manufacturing employment is growing at the fastest pace since 1995 and currently at a 9.5-year high.

Factory orders in the U.S. came in

The Bureau of Labor Statistics (BLS) reported the U.S. economy added 250,000 jobs in October and the unemployment rate remained low at 3.7%. The headline jobs report number is far more than the 180,000 forecast, and even the whisper number (200K).

The labor force participation rate ticked up to 62.9% and the employment-population ratio also edged up (0.2) to 60.6 percent in October. The latter has increased by 0.4% over the year.

While average hourly earnings (wages) for all employees on private nonfarm payrolls rose by just 5 cents to $27.30, wages have increased by 83 cents, or 3.1%. Average hourly earnings of private-sector production and nonsupervisory employees increased by 7 cents to $22.89 in October.

Wages have been helped the quality of jobs being created.

In October, employment in manufacturing increased by 32,000 and 296,000 jobs over the year, largely in durable goods. This represents a total reversal in trend from the previous administration, as does the employment trend in mining.

Employment in mining also continued to trend up over the month (+5,000). The industry has added 65,000 jobs over the year, reversing net negative losses under the previous administration.

Construction employment increased by 30,000, with nearly half of the gain occurring among residential specialty trade contractors (+14,000).

Over the year, construction has added a whopping 330,000 jobs.

The U.S. economy added 250,000 jobs in

Radiologist doctor checking x-ray, healthcare, medical and radiology concept. (Photo: AdobeStock)

Radiologist doctor checking x-ray, healthcare, medical and radiology concept. (Photo: AdobeStock)

It’s no secret that investing in biotechnology is a very risky business. An investor has to take a leap of faith in the product development cycle, the technology, and the leadership team. In other words, you have to be a true believer. InVivo Therapeutics Holdings Corp. (NVIV), a biotech firm attempting to find the holy grail for spinal cord injuries, has recently made that leap much easier by hiring a board-certified neurosurgeon, Richard Toselli, as its new CEO.

Toselli hasn’t wasted any time righting the ship, after a prior trial of their main product – the Neuro-Spinal Scaffold developed to repair spinal cord injury, was halted after several patients in the initial trial passed away. Although the deaths were deemed not related to the scaffold or procedure by the principal investigators, there was a cloud over the company’s future.

Toselli’s first goal was to reduce the cash burn of the company by nearly fifty percent to free up company resources for another product trial. With the cost savings put in place, InVivo was recently approved for the Insipre 2.0 trial of their Neuro-Spinal Scaffold by the FDA.

In addition to austerity measures, InVivo just completed a $15.2 million public offering which included an exercise of the underwriter’s overallotment option. I asked Dr. Toselli if InVivo had enough money to move forward and he replied saying, “We are comfortable we have enough money to complete the second trial and begin development of new products.”

With six months of data completed and verified from the Inspire 1.0 study, the company is optimistic about future results now that the FDA is allowing InVivo to move forward.

“Our priority is to focus on our core competencies, advance our breakthrough Neuro-Spinal Scaffold clinical program, and achieve this progress in an expedited, cost-efficient manner,” Toselli said in a statement.

“What I want people to understand is that we have a new beginning at InVivo,” declared Toselli in our recent conversation.

Toselli should know what’s he’s talking about. He has led an accomplished career in surgical medical affairs, with senior leadership experience at Sanofi, DePuy, and Johnson & Johnson.

Having an experience neurosurgeon at the helm of InVivo has obviously given investors comfort to fund another go at developing the product. “We have patient investors who are passionate about the business,” Toselli told me.

It looks as if InVivo has found some true believers. Now they just have to deliver.

InVivo Therapeudics (NVIV), a biotech firm attempting

American Manufacturing Sector Graphic Concept. (Photo: AdobeStock)

American Manufacturing Sector Graphic Concept. (Photo: AdobeStock)

The Institute for Supply Management (ISM) manufacturing index (PMI) came in at 57.7%, a slight easing but still indicative of solid sector growth.

“Comments from the panel reflect continued expanding business strength,” said Tim Flore, Chair of the ISM Manufacturing Business Survey Committee. “Demand remains moderately strong, with the New Orders Index easing to below 60 percent for the first time since April 2017, the Customers’ Inventories Index remaining low but improving, and the Backlog of Orders Index remaining steady.”

The New Orders Index came in at 57.4%, down from an overheated 61.8%. The Production Index came in at 59.9%, a 4-point decline from the September reading of 63.9%. The Employment Index clocked in at 56.8%, down from 58.8%.

“The expansion of new export orders softened, but five of six major industries contributed, up from two in September,” Mr. Fiore added. “Prices pressure continues, with the index returning above 70 percent. Overall, the manufacturing community continues to expand, but at the lowest level since April 2018.”

Of the 18 manufacturing industries, 13 reported growth in October, in the following order: Textile Mills; Electrical Equipment, Appliances & Components; Apparel, Leather & Allied Products; Plastics & Rubber Products; Food, Beverage & Tobacco Products; Computer & Electronic Products; Furniture & Related Products; Miscellaneous Manufacturing; Machinery; Transportation Equipment; Printing & Related Support Activities; Chemical Products; and Paper Products.

The Supplier Deliveries Index came in at 63.8%, down from the prior reading of 61.1%. The Inventories Index registered 50.7% and the Prices Index registered 71.6%, a 4.7-percentage point increase from the September reading of 66.9%. That indicates higher raw materials prices for the 32nd consecutive month.

The 4 industries reporting contraction in October are: Wood Products; Primary Metals; Nonmetallic Mineral Products; and Fabricated Metal Products.

The Institute for Supply Management (ISM) manufacturing

People's Pundit Daily
You have %%pigeonMeterAvailable%% free %%pigeonCopyPage%% remaining this month. Get unlimited access and support reader-funded, independent data journalism.

Start a 14-day free trial now. Pay later!

Start Trial