Widget Image
Follow PPD Social Media
Wednesday, January 15, 2025
HomeStandard Blog Whole Post (Page 161)

New York Stock Exchange (NYSE) Building in the Lower Manhattan Financial District, New York City. (Photo: Tomasz Zajda/AdobeStock/PPD)

New York Stock Exchange (NYSE) Building in the Lower Manhattan Financial District, New York City. (Photo: Tomasz Zajda/AdobeStock/PPD)

Stocks traded in a wide range Thursday, while in negative territory all day. Oil added to its correction from Wednesday inspiring further profit taking in energy stocks. The technology sector held up better than the broad market, contra to yesterday. Notably, Alphabet Inc (GOOG), Facebook Inc. (FB) and Microsoft Corporation (MSFT) finished green along with a few names in the semiconductor space.

Volumes were brisk as the largest investors moved to reallocate assets in response to higher interest rates and the likelihood of a slowing in the rate of earnings growth following imminent Q3 reporting season. With bond yields offering the highest returns in 7 years, diversified funds may be increasing their fixed income exposure, particularly after stellar equity performance in Q3. As market averages doubled their losses between 2:30 and 3:00 PM there was exceptionally downside volume in broad market equity ETFS accompanied by a sharp spike in the upside volume of bond surrogate ETFs.

This was clearly a result of an asset allocation shift from stocks to bonds at macro level by 1 or more large institutional manager.

Additionally, relative price action among stock sectors clearly indicates a lowering of exposure in high beta names with stretched valuations in favor of names and sectors that have trailed market performance most of the year.

Where yesterday the market action reflected wholesale liquidation across all sectors, today was emblematic of a Valuation Correction. Market Breadth data after the close reinforces the sector price action that jumped off the screen at us during the day. Breadth was decidedly negative, but not quite the total indiscriminate selling from Wednesday:

Declining issues led advancers by just less than 4 to 1. Yesterday issues were 8 to 1 negative.

Down volume was 5x Up volume. Yesterday Dvol was 10x Uvol.

The New York Stock Exchange (NYSE) had 526 new 52 week lows following 502 new lows yesterday. While this does give us 2 days in a row with 500+ new lows, it’s very likely that a high percentage of today’s new lows ore the same stocks that made new lows yesterday. Given that the two indicators above showed improvement, it’s hard to be convinced the selling has been totally exhausted.

Stocks traded in a wide range Thursday,

A doctor puts his hand over his chest during a "House call" rally against proposed healthcare reform legislation at the Capitol in Washington November 5, 2009. (Photo: Reuters)

A doctor puts his hand over his chest during a “House call” rally against proposed healthcare reform legislation at the Capitol in Washington November 5, 2009. (Photo: Reuters)

The Centers for Medicare & Medicaid Services (CMS) said average premiums have dropped for the first time since the implementation of the federally-run health exchange in 2014. The average premium for the popular, second-lowest cost silver plans (SLCSP) for the 2019 coverage year will drop by 1.5%, with much larger drops in particular states (see below).

CMS Administrator Seema Verma argued the average premium declines — coupled with increased issuer participation for the year — vindicate the numerous actions taken by the Trump Administration to stabilize what previously were failing health exchanges.

“President Trump’s Administration took action to address the skyrocketing price of health insurance, and now we are starting to see the results,” Administrator Verma said in a statement. “Despite predictions that our actions would increase rates and destabilize the markets, the opposite has happened.”

On Inauguration Day, President Donald Trump signed an executive order placing a freeze on federal regulations and easing burdensome regulations mandated by ObamaCare. Within a month of Inauguration Day and at the president’s direction, CMS put together a market stabilization rule and used its waiver authority to approve reinsurance programs in 7 states, resulting in lower premiums.

President Trump, working closely with Senator Rand Paul, R-Kty., signed an executive order expanding healthcare associations and allowing the purchase of insurance across state lines. Prior to the plan, insurers were dropping out of the exchanges one after another.

For the 2016 plan year, there were 237 medical qualified health plan (QHP) issuers operating on federal exchanges. By 2017, there were only 167 medical QHP issuers, a decline of roughly 30%. By 2018, more than half of U.S. counties on the federal platform had only one issuer. A CMS study found 1,200 counties, or roughly 40% of the country, would have only one issuer in 2018 if the actions weren’t taken.

“The drop in benchmark plan premiums for plan year 2019 and the increased choices for Americans seeking insurance on the exchanges is proof positive that our actions are working,” Administrator Verma added. “While we are encouraged by this progress, we aren’t satisfied. Even with this reduction, average rates are still too high. If we are going to truly offer affordable, high quality healthcare, ultimately the law needs to change.”

While the Democratic supermajority in the 111th U.S. Congress passed ObamaCare and it was signed into law by President Barack Obama on March 23, 2010, regulations didn’t take effect until 2014. President Obama signed several executive orders hoping to save vulnerable Red State Democrats from defeat in the 2014 midterm elections.

He was unsuccessful.

Despite months of grabbling with website cronyism and incompetency, the regulations mandated by the Patient Protection and Affordable Care Act (PPACA) took effect in 2014. According to data (below) from Health and Human Services (HHS), average individual market premiums more than doubled from $2,784 per year in 2013 to $5,712 on HealthCare.gov in 2017, an increase of $2,928 or 105%.

The report found HealthCare.gov states between 2017 and 2018 saw their average premium for the second-lowest cost silver plan increase by 37%. Between 2016 and 2017, the hike in average premiums was 25%.

Administrator Verma said CMS took actions to address market stability and, as a result, competition led to more issuers, which led to lower average premiums.

In 2019, there will be 23 more medical QHP issuers than were participating during open enrollment in 2018. Further, 29 current medical QHP issuers are expanding their service area into more counties. The number of counties with only one insurer has dropped from 56% in 2018 to 39% in 2019.

Only 4 states will have only one insurer, compared to 10 in 2018.

“The president who was supposedly trying to sabotage the Affordable Care Act has proven better at managing it than the president who wrote the law,” HHS Secretary Alex Azar said recently during a speech to a health policy group in Nashville.

The state of Tennessee saw the largest drop in premiums, with the cost of that silver plan falling 26.2%. The Volunteer State is currently at the center of the battle for control of the U.S. Senate in November. Rep. Marsha Blackburn, R-Tenn., was thought to be in a tight race against former Democratic Governor Phil Bredeson.

However, the race has moved away from the Democrats in the last few weeks, as have many others on the GOP-friendly map. Healthcare continues to ascend as a top voting issue as optimism about the state of the economy increases. The PPD Election Projection Model now projects the U.S. Senate election in Tennessee Likely Republican.

About the CMS Study

To determine the year-over-year changes, CMS analyzed Exchange individual plan year 2019 premium data submitted as of September 28, 2018, as part of the QHP certification process. Average premiums were then weighted, based on 2018 Exchange enrollment data. Data is subject to change due to plan withdrawals.

[su_document url=”https://www.peoplespunditdaily.com/wp-content/uploads/2018/10/Individual-Market-Premium-Changes-HHS-CMS.pdf” width=”720″ height=”860″]

The Centers for Medicare & Medicaid Services

Dwight D. Eisenhower’s warning about our Education-Government system has finally come true as our terrible education system is producing row after row of mushy headed liberal robots.

Liberty Never Sleeps Banner

Support Liberty Never Sleeps on Patreon!

*Hurricane Michael
*Zhivago Liberals
*Rotten Middle School
*Leftist Indoctrination Centers
*The Final Straw
*Damaged Leaders

Today’s Bumpers:

Cold as Ice- Foreigner
Dust in the Wind- Kansas
Don’t Stand So Close- Sting and the Police
Voices Carry- ‘Til Tuesday
Everybody Wants to Rule the World- Tears For Fears
Boys of Summer- Don Henley

Closing Music
http://www.hulkshare.com/praktikos/dark-nights-rise

The money pledged thru Patreon.com will go toward show costs such as advertising, server time, and broadcasting equipment. If we can get enough listeners, we will expand the show to two hours and hire additional staff.

To help our show out, please support us on Patreon: https://www.patreon.com/LibertyNeverSleeps

All bumper music and sound clips are not owned by the show, are commentary, and of educational purposes, or de minimus effect, and not for monetary gain.

No copyright is claimed in any use of such materials and to the extent that material may appear to be infringed, I assert that such alleged infringement is permissible under fair use principles in U.S. copyright laws. If you believe material has been used in an unauthorized manner, please contact the poster.

Dwight D. Eisenhower's warning about our Education-Government

U.S. jobless claims graph on a tablet screen. (Photo: AdobeStock)

U.S. jobless claims graph on a tablet screen. (Photo: AdobeStock)

The Labor Department (DOL) reported initial jobless claims came in at a seasonally adjusted 214,000, up 7,000 from the previous week’s unrevised level of 207,000. The 4-week moving average came in at 209,500, a gain of 2,500 from the previous week’s unrevised average of 207,000.

The advance seasonally adjusted insured unemployment rate was unchanged at a very low 1.2% for the week ending September 29. The advance number for seasonally adjusted insured unemployment during the week ending September 29 was 1,660,000, an increase of 4,000 from the previous week’s revised level.

The previous week’s level was revised up 6,000 from 1,650,000 to 1,656,000.

The 4-week moving average declined by 10,000 from the previous week’s revised average to 1,656,000. This is the lowest level for this average since August 18, 1973 when it was 1,646,750. The previous week’s average was revised up by 1,500 from 1,664,500 to 1,666,000.

No state was triggered “on” the Extended Benefits program during the week ending September 22.

The highest insured unemployment rates in the week ending September 22 were in New Jersey (1.9), Alaska (1.8), California (1.7), Connecticut (1.6), Puerto Rico (1.6), Pennsylvania (1.5), the District of Columbia (1.3), Massachusetts (1.3), Nevada (1.3), and the Virgin Islands (1.3).

The largest increases in initial claims for the week ending September 29 were in South Carolina (+1,040), Ohio (+442), Illinois (+412), Minnesota (+213), and Iowa (+148), while the largest decreases were in North Carolina (-4,796), Kentucky (-4,625), California (-960), New York (-841), and Texas (-547).

The Labor Department reported initial jobless claims

A downtrend depicts the graphic concept of market volatility. (Photo: AdobeStock)

A downtrend depicts the graphic concept of market volatility. (Photo: AdobeStock)

Stocks had their largest day to the downside since June, exactly one week after the Dow Jones Industrial Average (.DJI) celebrated a string of 3 consecutive all-time highs. This “correction” actually started mid day on October 3rd, sparked by comments from FED Chairman Jerome Powell on “how remarkably strong the economy was.”

Markets should give Chairman Powell a “pass” for not pre screening his comments through an English to “Fed Speak” translation service. Not being an academically programmed PhD economist, the FED Chair clearly thought he was giving the economy and the current state of fiscal policy his highest compliment.

Still relatively new in his role, Chairman Powell missed the translation that “remarkably strong” in FED Speak comes through as “we’re going to aggressively tighten at a faster rate and for longer than you think”. The bond market took immediate notice. The benchmark 10 year note, which had been meandering just above the 3% threshold for a week and a half, closed the day above 3.15% the highest yields seen in over 7 years. The following day it hit 3.2%, and spent the following 3 days between 3.2% and 3.25%.

Stocks reacted with less vigor. While the DJIA gave up two-thirds of its midday gains it still logged a 3rd straight all time high, while the S&P 500 (.INX) mass posting a fresh high by merely 5 points.

Finally, a full week later, equity markets succumbed to the relentless drumbeat of “impending inflation”, “higher rates choking off the economy”, “peak earnings”,  “burgeoning budget deficits”, “panic at Wall and Broad”.

Just to put it in perspective, the sell off yesterday doesn’t even rant on the Top 50 largest declines in the annals of financial history.  Much like hurricane Michael, which a week ago had the “possibility” being upgraded from a tropical storm to a hurricane, the ingredients for this selloff percolated behind the scenes for the better part of a week, rapidly developing into a storm that hit with accelerating force on Wednesday.

The biggest difference between Wednesday and the sell offs earlier in the week, that lost steam and self corrected by days end was that Oil was lower by close to $2 yesterday, sparking a sharp correction in energy stocks, which had provided support for an otherwise weak market earlier in the weak.

3 Key Data Points:

  • Declining issues led Advancing issues by 10 to 1.  On Monday and Tuesday, this was fractionally less than 50/50.

  • Down Volume was 90% of total volume.  If Down volume hits 90% of total volume 2 days in a row, many technical analysts will call the market oversold on at least a short term basis.

  • The NYSE had 502 new 52 week lows.  Similar to UVOL/DVOL, the 52 week lows could give an oversold signal with a reading above 500 2 days in a row.

Early Thursday morning the 10-Year Treasury Yield (US10YBY) is below 3.2% for the first time in a week. The Treasury issued 3 year and 10 year notes yesterday, and we’ll get results from today’s 30 year bond auction at 1:00 PM today. Expect a relief rally in the bond market after completion of this 2 day auction. Likewise, a relief rally in stocks either this afternoon, tomorrow, or early next week as the focus turns to Q3 earnings.

Stocks had their largest day to the

The Euro model (ECMWF) forecasts Hurricane Michael to make landfall as a Category 4 at the Florida Panhandle and Big Ben along the U.S. Gulf Coast on Wednesday afternoon. The model above tracks over a 240-hour period beginning the afternoon of Wednesday, October 10, 2018.

Specific location for landfall ranges from Apalachicola to Panama City, which are already seeing significant flooding. Never before has a storm this strong made landfall in this region of Florida.

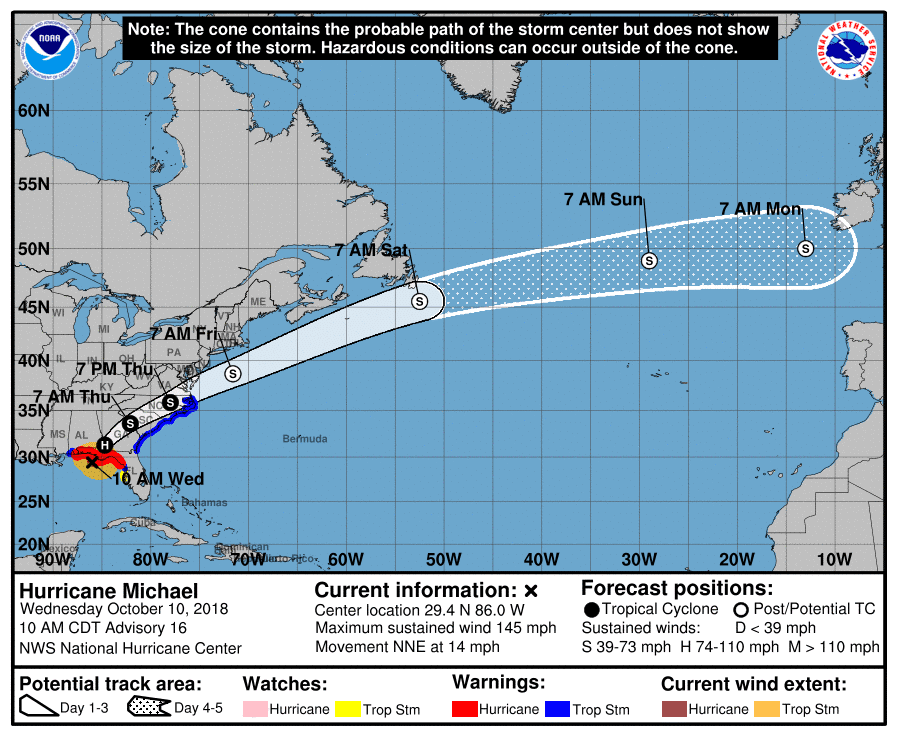
The National Hurricane Center (NHC) in Miami said Hurricane Michael is currently moving toward the north-northeast near 14 mph (22 km/h). A northeast turn is expected this afternoon or tonight, and indeed began a bit earlier than the GFS model used by NHC predicted.

This graphic shows an approximate representation of coastal areas under a hurricane warning (red), hurricane watch (pink), tropical storm warning (blue) and tropical storm watch (yellow). The orange circle indicates the current position of the center of the tropical cyclone. The black line, when selected, and dots show the National Hurricane Center (NHC) forecast track of the center at the times indicated. The dot indicating the forecast center location will be black if the cyclone is forecast to be tropical and will be white with a black outline if the cyclone is forecast to be extratropical. If only an L is displayed, then the system is forecast to be a remnant low. The letter inside the dot indicates the NHC's forecast intensity for that time: D: Tropical Depression – wind speed less than 39 MPH S: Tropical Storm – wind speed between 39 MPH and 73 MPH H: Hurricane – wind speed between 74 MPH and 110 MPH M: Major Hurricane – wind speed greater than 110 MPH

This graphic shows an approximate representation of coastal areas under a hurricane warning (red), hurricane watch (pink), tropical storm warning (blue) and tropical storm watch (yellow). The orange circle indicates the current position of the center of the tropical cyclone. The black line, when selected, and dots show the National Hurricane Center (NHC) forecast track of the center at the times indicated. The dot indicating the forecast center location will be black if the cyclone is forecast to be tropical and will be white with a black outline if the cyclone is forecast to be extratropical. If only an L is displayed, then the system is forecast to be a remnant low. The letter inside the dot indicates the NHC’s forecast intensity for that time:
D: Tropical Depression – wind speed less than 39 MPH
S: Tropical Storm – wind speed between 39 MPH and 73 MPH
H: Hurricane – wind speed between 74 MPH and 110 MPH
M: Major Hurricane – wind speed greater than 110 MPH

A motion toward the northeast at a faster forward speed is forecast on Thursday through Friday night. On the forecast track, the core of Hurricane Michael is expected to move ashore along the Florida Panhandle early this afternoon, move northeastward across the southeastern United States tonight and Thursday, and then move off the Mid-Atlantic coast away from the United States on Friday.

Data from NOAA and Air Force Reserve Hurricane Hunter aircraft indicate that maximum sustained winds are near 145 mph (230 km/h) with higher gusts. Michael is an extremely dangerous category 4 hurricane on the Saffir-Simpson Hurricane Wind Scale. Some strengthening is still possible before landfall. After landfall, Michael should weaken as it crosses the southeastern United States.

Michael is forecast to become a post-tropical cyclone on Friday, and strengthening is forecast as the system moves over the western Atlantic. Hurricane-force winds extend outward up to 45 miles (75 km) from the center and tropical-storm-force winds extend outward up to 175 miles (280 km).

A private weather station at Bald Point, Florida, recently reported a sustained wind of 54 mph (87 km/h) with a gust to 61 mph (98 km/h). A wind gust to 46 mph (74 km/h) was recently reported inland at Tallahassee, Florida. The latest minimum central pressure based on data from the reconnaissance aircraft is 928 mb (27.41 inches).

The latest minimum central pressure based on data from the reconnaissance aircraft is 928 mb (27.41 inches).

H/T: Tropical Tidbits

The Euro model (ECMWF) forecasts Hurricane Michael

Employees have short meeting in the warehouse to check business inventory levels of goods. First in first out. (Photo: AdobeStock)

Employees have short meeting in the warehouse to check business inventory levels of goods. First in first out. (Photo: AdobeStock)

The U.S. Census Bureau reported new wholesale trade statistics for August 2018 and the forecast-beating build-up will benefit third-quarter (Q3) gross domestic product (GDP). The widening of the U.S. trade deficit in Q3 is a marked change from the narrowing during tariff negotiations.

There were big revisions to previous estimates, all of which are a net boon for Q3 GDP. The Bureau of Economic Analysis (BEA) recently reported Q4 GDP held firm at 4.2% and Q3 economic growth is forecast to post another strong reading.

Sales

Sales of merchant wholesalers — except manufacturers’ sales branches and offices, after adjustment for seasonal variations and trading-day differences but not for price changes — were $511.1 billion in August 2018. That’s up 0.8% (±0.4%) from the revised July level and 9.2% (±3.5%) from the August 2017 level. The June 2018 to July 2018 percent change was revised from the preliminary estimate of virtually unchanged (±0.2%)* to up 0.2% (±0.4%)*.

Inventories

Total inventories of merchant wholesalers — except manufacturers’ sales branches and offices, after adjustment for seasonal variations but not for price changes — were $642.7 billion at the end of August, up 1.0% (±0.2%) from the revised July level. The median forecast expected 0.8%.

Total inventories were up 5.3% (±3.7%) from the revised August 2017 level. The July 2018 to August 2018 percent change was revised from the advance estimate of up 0.8% (±0.2%) to up 1.0% (±0.2%).

Inventories/Sales Ratio

The August inventories/sales ratio for merchant wholesalers, except manufacturers’ sales branches and offices, based on seasonally adjusted data, was 1.26. The August 2017 ratio was 1.30.

The U.S. Census Bureau reported new wholesale

Pedestrians walk through the Canary Wharf financial district of London January 16, 2009. (Photo: Reuters)

Pedestrians walk through the Canary Wharf financial district of London January 16, 2009. (Photo: Reuters)

Stocks have been on a rollercoaster ride the first two days of the trading week, as investors adjust to higher interest rates while awaiting the kickoff of third-quarter (Q3) earnings this Friday. Amidst a wide disparity between winners and losers market breadth has held steady with advancing issues trailing decliners by less than 10% both days.

The wide range of performance among Market Averages less than 2 weeks into Q4 spotlight the disparate appetite among major sectors and market themes.

The S&P 500 (.INX) at 2880 is lower by less than -0.2% on the week and sits right at its 50 day moving average. This is less than 2% off the September 20 ATH of 2930.75.

* The Dow Jones Industrial Average (.DJI) at 26,430 remains in the technically strongest position, close to 2% above its 50 day moving average of 25,991. During Q3 the DJIA went from underperformer to outperformer as the US dollar halted its multi month ascent in mid august and U.S. trade tensions eased most global trading partners other than China.

* NASDAQ Composite (.IXIC) at 7738, is 4% below the August 31 closing high of 8110. It broke the 50 day moving average at 7922 last Thursday, and is now halfway between the 50 day and 200 day MA of 7504. The technology space has withstood a few sharp selloffs during the year. The dual headwinds of internet privacy concerns and potential regulatory oversight, may prove its toughest test.

* The DJ Transports at 10,996 is also close to halfway between its 50 and 200 day moving averages. After leading the pack with a +10% gain in Q3, the Transports are 5% off their closing high of 11,571 from mid September. The Transports have always rivaled the technology as a high volatility index, with much of the damage the last 2 weeks attributable to steadily higher Oil prices. The 200 day MA of 10,816 is less than 200 points below. With a 208 decline on Tuesday, further downside could test that level before week’s end.

* The Russell 2000 (INDEXRUSSELL: RUT) at 1622 is merely 2 points above its 200 day moving average of 1620. Like the NASDAQ, the Russell 2000 posted its closing ATH of 1740 on August 31. That’s where the comparisons end. The Russell is 6.8% below its ATH from late August, with the majority of that decline coming in the last 7 trading days. The 1600 to 1620 level should be a major test of longer term support on any further declines.

Interest Rates Remain in Focus

Rising rates have been very much in focus with the 10-Year Treasury Yield (US10YBY) ranging from 3.20% to 3.25%, levels not seen for over 7 years. The next 2 days will be telling for rates as the Treasury auctions 3 year and 10 year notes today, followed by 30 year bonds on Thursday. Given investors have not seen these yields since 2011, buyers, and we’re sure there are many, have been in no rush to commit with Billions of supply just around the corner. Should the 3 part auction meet strong demand, it’s likely 3.25% will be cast as a meaningful support level, halting the 40 basis point run in 10 year yields over the last 4 weeks.

Q3 Earnings

With the intense focus in rising treasury yields, it’s appropriate that the Q3 earnings season kicks off Friday with a handful of the major money center banks reporting Q3 earnings. As much as the rise in rates and day to day volatility has put investors back on their heels a bit this week, as we’ve seen so many times, next week could be a different story. If rates back up below 3.20% after the auction today and tomorrow and Q3 earnings get off to a strong start this Friday and early next week, look for stocks to get their footing by early to mid next week.

Investors adjust for higher interest rates, while

Producer Price Index (PPI) Graphic

Producer Price Index (PPI) Graphic

The U.S. Bureau of Labor Statistics (BLS) reported the Producer Price Index (PPI) for final demand increased by a seasonally adjusted 0.2% in September, matching the consensus forecast. Final demand prices declined 0.1% in August and were unchanged in July. On an unadjusted basis, the final demand index advanced 2.6% for the 12 months ended in September.

In September, the rise in the final demand index can be traced to a 0.3% increase in prices for final demand services. In contrast, the index for final demand goods decreased 0.1%. The index for final demand less foods, energy, and trade services moved up 0.4% in September, the largest rise since a 0.5% increase in January. For the 12 months ended in September, prices for
final demand less foods, energy, and trade services advanced 2.9%.

The index for final demand services increased 0.3% in September following two consecutive declines of 0.1%. The broad-based advance was led by a 1.8% gain in the index for final demand transportation and warehousing services. Prices for final demand services less trade, transportation, and warehousing rose 0.3%, and the index for final demand trade services inched up 0.1%.

The index for final demand goods edged down 0.1 percent in September, the first decrease since a 0.5% decline in May 2017. Leading the September decline, prices for final demand energy fell 0.8%. The index for final demand foods decreased 0.6%. In contrast, prices for final demand goods less foods and energy rose 0.2%.

The Producer Price Index (PPI) for final

The Euro model (ECMWF) forecasts Hurricane Michael to make landfall at the Florida Panhandle and Big Ben along the U.S. Gulf Coast on Wednesday afternoon. The model above tracks over a 126-hour period beginning the morning of Wednesday, October 10, 2018.

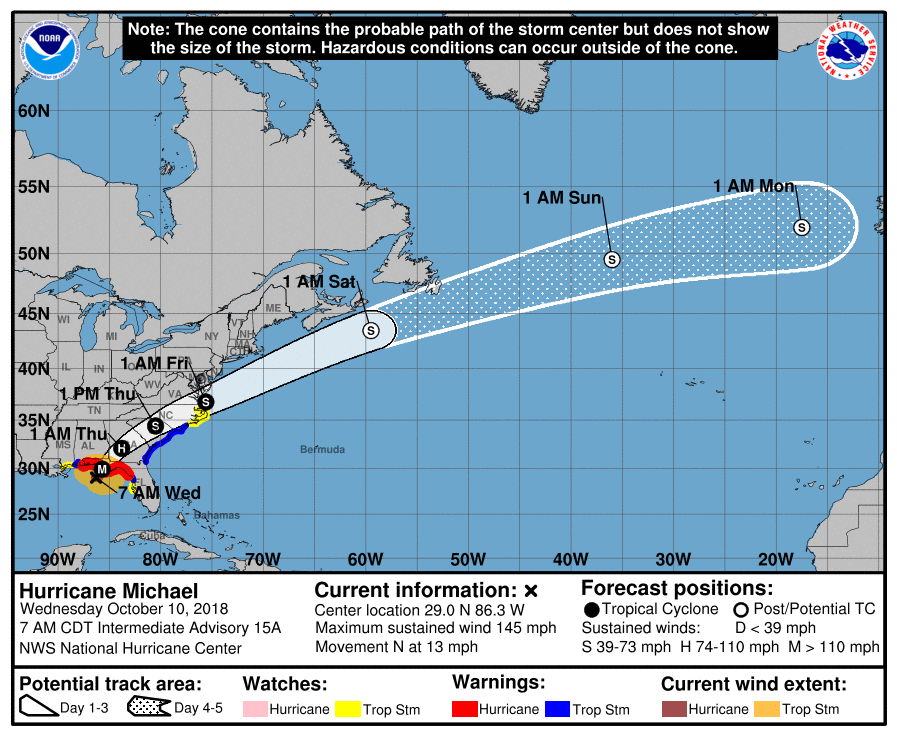
Hurricane Michael strengthened to a Category 4 Tuesday night and could be the strongest storm to make landfall in the history of the panhandle and potentially for the Gulf Coast ever for the month of October.

Below is the latest forecast cone from the National Hurricane Center (NHC) in Miami, Florida.

This graphic shows an approximate representation of coastal areas under a hurricane warning (red), hurricane watch (pink), tropical storm warning (blue) and tropical storm watch (yellow). The orange circle indicates the current position of the center of the tropical cyclone. The black line, when selected, and dots show the National Hurricane Center (NHC) forecast track of the center at the times indicated. The dot indicating the forecast center location will be black if the cyclone is forecast to be tropical and will be white with a black outline if the cyclone is forecast to be extratropical. If only an L is displayed, then the system is forecast to be a remnant low. The letter inside the dot indicates the NHC's forecast intensity for that time: D: Tropical Depression – wind speed less than 39 MPH S: Tropical Storm – wind speed between 39 MPH and 73 MPH H: Hurricane – wind speed between 74 MPH and 110 MPH M: Major Hurricane – wind speed greater than 110 MPH

This graphic shows an approximate representation of coastal areas under a hurricane warning (red), hurricane watch (pink), tropical storm warning (blue) and tropical storm watch (yellow). The orange circle indicates the current position of the center of the tropical cyclone. The black line, when selected, and dots show the National Hurricane Center (NHC) forecast track of the center at the times indicated. The dot indicating the forecast center location will be black if the cyclone is forecast to be tropical and will be white with a black outline if the cyclone is forecast to be extratropical. If only an L is displayed, then the system is forecast to be a remnant low. The letter inside the dot indicates the NHC’s forecast intensity for that time:
D: Tropical Depression – wind speed less than 39 MPH
S: Tropical Storm – wind speed between 39 MPH and 73 MPH
H: Hurricane – wind speed between 74 MPH and 110 MPH
M: Major Hurricane – wind speed greater than 110 MPH

Hurricane-force winds extend outward up to 35 miles (55 km) from the center and tropical-storm-force winds extend outward up to 175 miles (280 km). Additional strengthening is expected, and Hurricane Michael is forecast to be a major hurricane at landfall in Florida. Weakening is expected after landfall as Michael moves through the southeastern United States.

Reports from an Air Force Reserve Hurricane Hunter aircraft indicate that maximum sustained winds have increased to near 145 mph (230 km/h) with higher gusts. Michael is an extremely dangerous category 4 hurricane on the Saffir-Simpson Hurricane Wind Scale.

H/T: Tropical Tidbits

The Euro model (ECMWF) forecasts Hurricane Michael

People's Pundit Daily
You have %%pigeonMeterAvailable%% free %%pigeonCopyPage%% remaining this month. Get unlimited access and support reader-funded, independent data journalism.

Start a 14-day free trial now. Pay later!

Start Trial