Widget Image
Follow PPD Social Media
Friday, February 7, 2025
HomeStandard Blog Whole Post (Page 177)

A Boeing 737 MAX plane is seen during a media tour of the Boeing 737 MAX at the Boeing plant in Renton, Washington December 7, 2015. (Photo: Reuters)

A Boeing 737 MAX plane is seen during a media tour of the Boeing 737 MAX at the Boeing plant in Renton, Washington December 7, 2015. (Photo: Reuters)

New orders for manufactured durable goods decreased $4.3 billion or 1.7% to $246.9 billion, the U.S. Census Bureau said Friday. This decrease, down 3 of the last 4 months, followed a 0.7% June increase.

Excluding transportation, new orders increased 0.2%. Excluding defense, new orders decreased 1.0%. Transportation equipment, also down 3 of the last 4 months, fueled the overall decline, falling $4.6 billion or 5.3% to $82.8 billion.

Shipments also declined following 2 consecutive monthly increases, fell $0.5 billion or 0.2% to $250.8 billion. This followed a 1.6 percent June increase. Transportation equipment, down 3 of the last 4 months, drove the decrease, $1.6 billion or 1.9% to $83.9 billion.

Unfilled orders have been up 8 of the last 9 months, and continued to increase $0.1 billion to $1,164.7 billion. This followed a 0.3% increase in June.

Inventories have been up 18 of the last 19 months, and increased $5.0 billion or 1.3% to $408.3 billion in July. This followed a virtually unchanged June decrease. Transportation equipment, up 3 of the last 4 months, led the increase, $4.4 billion or 3.5% to $131.3 billion.

New orders for manufactured durable goods decreased

Emigrants at the Gates, Colomon Butcher, depicts the trail for American pioneers.

Emigrants at the Gates, Colomon Butcher, depicts the trail for American pioneers.

Reading about some of the early pioneers from our early American history, I noticed that they didn’t live very long. In fact, on numerous occasions on trips to old western towns and other historical spots, I noticed the dates on gravestones were very often not much later than the birth date. Besides the obvious shortened lives due to childbirth and stillborns, I noticed quite a few young men in early graves too.

At least by our standards. An old man 150 years ago was over 50. Now it’s well over 80.

Of course, life was much harsher then too. The interesting thing about Americans 150 or so years ago was that there was no denying they were freer, and had more personal liberties than we do now. They arguably had more exposure to guns and violence, traveled by foot into harsher, more untamed lands, and generally had less access to medicine and high quality diets.

However, I noticed they didn’t complain about it too much. Oh sure, there were some that wanted a longer life, but for most people access to a higher quality of living didn’t necessarily mean a longer life. Or that government would provide it for them. The literature and correspondence from those years were more focused on how they were making a better life for their kids from hard work, not for themselves via governmental powers.

In fact, the reason people are living longer now than they did back then, is very simple. The people were free to build, develop and sell better products and inventions. Many Americans got fabulously wealthy inventing things that gave us a longer and healthier lifestyle, from the electric light bulb to modern pharmaceuticals. Capitalism developed all the comforts that now extend our lives and give us a better quality of life.

Attitudes in America have shifted a lot in those 150 years. Now people still want a longer life, but those demands are now directed at government. People want free health care and more laws to protect their lives and safety. Some even think that laws that prevent people from hitting each other in the head with a football on the beach are somehow an improvement on the quality of life. Many want to abandon the economic and societal principles that got us here in an effort to reinvent the American experience.

If you were to transplant a pioneer from 150 years ago into a modern day environment, they probably would be appalled.

You see all of the things that some people are demanding today from government are not going to prolong life, or increase its quality. At least the pioneers didn’t think so, and the economic track record bears them out.

While other nations have had strong centralized governments and detailed socialistic societal policies in place for far longer than America has, it certainly hasn’t brought them a better quality of life. The poorest of Americans have access to substantially more benefits than the poorest of other nations. We even provide free cell phones to the homeless.

The astonishing wealth of the American economy did not come from a strong and powerful government, but from a strong and powerful people. Now, that wealth did not come without a price—as I mentioned earlier, the graveyards are full of the young people that sacrificed to build this nation.

But I don’t think very many of them would have had kind words for leaders that think taking 30 to 50 percent of a man’s earning to protect them, was a good idea.

Freedom, wealth and a high standard of living doesn’t come at the hands of government benefits or societal policies and laws; it comes from the busy and hardworking hands of its people. Our government now wants to tell us how to eat, take our paychecks and pay for medical care for all of us, and, in essence, how to live our lives.

Many will point out that other nations now have a higher life expectancy than America. This much is true. The reason Americans don’t live as long, however, is because they live better and more free than their global counterparts. Americans die more often from overeating rich foods and sitting around living a life of leisure than do others.

We may live a few years less than a man living in Germany or Japan, but I don’t think giving up our national heritage and our freedoms is worth it.

You have a choice as Americans to live as you see fit. You can live like a monk and scrape out a few more years, or eat Twinkies and Whoppers in front of the TV all day, or take drugs and party all night and die younger.

But at least here you have a choice.

I prefer having a choice. Don’t you?

Many want to abandon the economic and

Reality Winner, a 25-year-old NSA contractor and Air Force veteran, was also an Islamist sympathizer and radical left hater of President Trump. (Photo: DoJ)

Reality Winner, a 25-year-old NSA contractor and Air Force veteran, was also an Islamist sympathizer and radical left hater of President Trump. (Photo: DoJ)

Reality Winner, the leaker who wrote that she wanted “to burn the White House Down,” was sentenced to 5 years and 3 months in prison. had been arrested by the Federal Bureau of Investigation (FBI) at her home in Augusta, on June 3, 2017.

For her crimes, Ms. Winner, who also wrote in her notebook that she planned to travel to Afghanistan to pledge her allegiance to the Taliban, has received the stiffest sentence ever for the charge. Ms. Winner, 26, removed classified national security information from a government facility and mailed it to a news outlet with the hope to politically damage President Donald Trump.

The Justice Department (DOJ) — under their own cloud of scandal from abuse before, during and after the 2016 presidential election — made an example out of Ms. Winner.

“The defendant schemed to take and disclose classified information she had sworn to protect – and then did so almost as soon as she had the chance,” said Assistant Attorney General Demers. “Today, she has been held accountable for her crime thanks to the hard work of the Department’s prosecutors and agents. I hope their success will deter others from similar unlawful action in the future.”

Prosecutors did concede they aren’t arguing Winner is a jihadist or terrorist sympathizer, though she does have ties to the Women’s March organizers, led by Linda Sarsour, a radical Islamist.

Ms. Winner, in a jailhouse phone call, told her mother that she “screwed up.”

“Mom, those documents. I screwed up,” she confessed in a recorded jailhouse phone call.

She also told her to tell the media that her daughter was “scared.”

“This defendant used her position of trust to steal and divulge closely guarded intelligence information,” said U.S. Attorney Bobby L. Christine. “Her betrayal of the United States put at risk sources and methods of intelligence gathering, thereby offering advantage to our adversaries.”

On or about May 9, 2017, Ms. Winner printed an intelligence report that was classified at the TOP SECRET//SCI level, and removed it from the facility where she worked. On May 9, she leaked a hard copy of the intelligence report to an online news outlet, revealing sources and methods.

In an interview with the FBI on June 3, 2017, Ms. Winner admitted knowing at the time she stole and leaked the intelligence report and that it contained information about intelligence sources and methods, which she knew was valuable to U.S. adversaries.

Further, DOJ said the information contained in the intelligence report had not been released to the public at the time she retained it and leaked it to the online news outlet. Prosecutors also noted that Ms. Winner received training regarding the proper handling, marking, transportation, and storage of classified information.

She was fully aware that it was not permitted to remove the intelligence report from the facility where she worked, retain it, or leak it to the news outlet.

“This U.S. Attorney’s Office will continue to work with the National Security Division, law enforcement and our intelligence partners to ensure such violations result in swift, certain prosecution,” U.S. Attorney Christine added.

On June 21, Ms. Winner agreed to plead guilty to the one-count indictment charging her with unlawful retention and transmission of national defense information. The parties also agreed upon a sentence of imprisonment for 63 months followed by a 3-year term of supervision, which the court accepted at sentencing.

“When obtaining Top Secret clearance as a government employee or contractor, the handling of top secret information is clearly spelled out along with the ramifications of mishandling such information,” said Acting Special Agent in Charge Hacker.

“Revealing sources and methods to the advantage of our adversaries and to the detriment of our country will never be acceptable and the FBI and Department of Justice will spare no effort to prosecute and punish anyone who would do so.”

Reality Winner, the leaker who wrote that

Mark Zuckerberg gestures while addressing the audience during a meeting of the APEC (Asia-Pacific Economic Cooperation) CEO Summit in Lima, Peru, November 19, 2016. (Photo: Reuters)

Mark Zuckerberg gestures while addressing the audience during a meeting of the APEC (Asia-Pacific Economic Cooperation) CEO Summit in Lima, Peru, November 19, 2016. (Photo: Reuters)

Facebook Inc. (NASDAQ: FB) removed a daily podcast for covering illegal immigration. Liberty Never Sleeps, a right-leaning daily podcast that airs Monday – Friday, was discussing the impact of illegal immigration in the wake of the death of Mollie Tibbetts.

The body of the 20-year-old Iowa college student was found in a cornfield after a month of intense mainstream media coverage of the search. But when it was revealed that she had been murdered by Cristhian Rivera, a 24-year-old illegal immigrant from Mexico, the blackout began.

Now, Facebook is calling a discussion of the case as it relates to illegal immigration, “hate speech.”

“As our popularity grows, these sorts of things will happen. The suppression of ideas, and the freedom of speech, we take seriously at Liberty Never Sleeps,” host and PPD contributing columnist Tom Purcell said in a statement. “There was nothing in today’s show which could even be construed remotely as ‘Hate Speech’.”

“Facebook never listened to the show, as it blocked the posting within a few seconds of posting. It only acted with the indifferent tyranny of an unresponsive bureaucracy.”

Apparently, because after a review of the claim and the episode, PPD determined the post was removed almost immediately and that the episode didn’t contain hate speech. Facebook did not respond to a request for comment.

“The free exchange of ideas is essential to living in a free nation and a democracy,” Mr. Purcell added. “When the ideas of one side of an argument or political debate are allowed to flourish, while another side is suppressed, you cannot have the governance of a nation by consent.”

Facebook has come under fire for mishandling users’ data and for seemingly targeting conservatives, or non-liberal media sites and personalities on their platform.

“Even if Facebook represents the interests of a private entity, it should not represent an obstacle to that free expression,” Mr. Purcell continued. “Such obstacles are a threat to liberty itself.”

Listen to “Liberty Never Sleeps” on Spreaker.

Facebook Inc. removed an episode of the

A real estate sign advertising a new home for sale is pictured in Vienna, Virginia, outside of Washington, October 20, 2014. (Photo: Reuters)

A real estate sign advertising a new home for sale is pictured in Vienna, Virginia, outside of Washington, October 20, 2014. (Photo: Reuters)

New home sales for single-family houses were at a seasonally adjusted annual rate of 627,000 in July 2018. This is 1.7% (±14.7%)* below the revised June rate of 638,000, but is 12.8% (±15.7 percent)* above the July 2017 estimate of 556,000.

While the report — released jointly on Thursday by the U.S. Census Bureau and the Department of Housing and Urban Development (HUD) — missed expectations, it is still a positive report and solid number for the month and 12-month.

The median sales price of new houses sold in July 2018 was $328,700. The average sales price was $394,300. The seasonally-adjusted estimate of new houses for sale at the end of July was 309,000. This represents a supply of 5.9 months at the current sales rate.

New home sales for single-family houses were

A U.S. flag decorates a for-sale sign at a home in the Capitol Hill neighborhood of Washington, August 21, 2012. (Photo: Reuters)

A U.S. flag decorates a for-sale sign at a home in the Capitol Hill neighborhood of Washington, August 21, 2012. (Photo: Reuters)

The Federal Housing Finance Agency (FHFA) House Price Index (HPI) rose 1.1% in the second quarter of 2018.  House prices are up 6.5% from the second quarter of 2017 to the second quarter of 2018.  FHFA’s seasonally adjusted monthly index for June was up 0.2% from May.

The HPI is calculated using home sales price information from mortgages sold to, or guaranteed by, Fannie Mae and Freddie Mac.  FHFA has produced a video of highlights for this quarter.

Significant Findings (H/T FHFA)

  • Home prices rose in all 50 states and the District of Columbia between the second quarter of 2017 and the second quarter of 2018. The top five areas in annual appreciation were: 1) Nevada 17.0 percent; 2) Idaho 13.0 percent; 3) District of Columbia 11.8 percent; 4) Utah 11.3 percent; and 5) Washington 11.0 percent. The states showing the smallest annual appreciation were: 1) North Dakota 2.1 percent; 2) Louisiana 2.3 percent; 3) West Virginia 2.3 percent;  4) Connecticut 2.4 percent; and 5) Alaska 2.6 percent.
  • Home prices rose in 99 of the 100 largest metropolitan areas in the U.S. over the last four quarters. Annual price increases were greatest in Las Vegas-Henderson-Paradise, NV, where prices increased by 18.8 percent. Prices were weakest in El Paso, TX, where they fell by 0.03 percent.
  • Of the nine census divisions, the Mountain division experienced the strongest four-quarter appreciation, posting a 9.5 percent gain between the second quarters of 2017 and 2018 and a 1.9 percent increase in the second quarter of 2018. The Pacific division, which often records the strongest numbers in the country, only had a quarterly appreciation of 0.6 percent, its slowest quarterly increase since 2011. Annual house price appreciation was weakest in the West South Central division, where prices rose 5.0 percent between the second quarters of 2017 and 2018.

The Federal Housing Finance Agency (FHFA) House

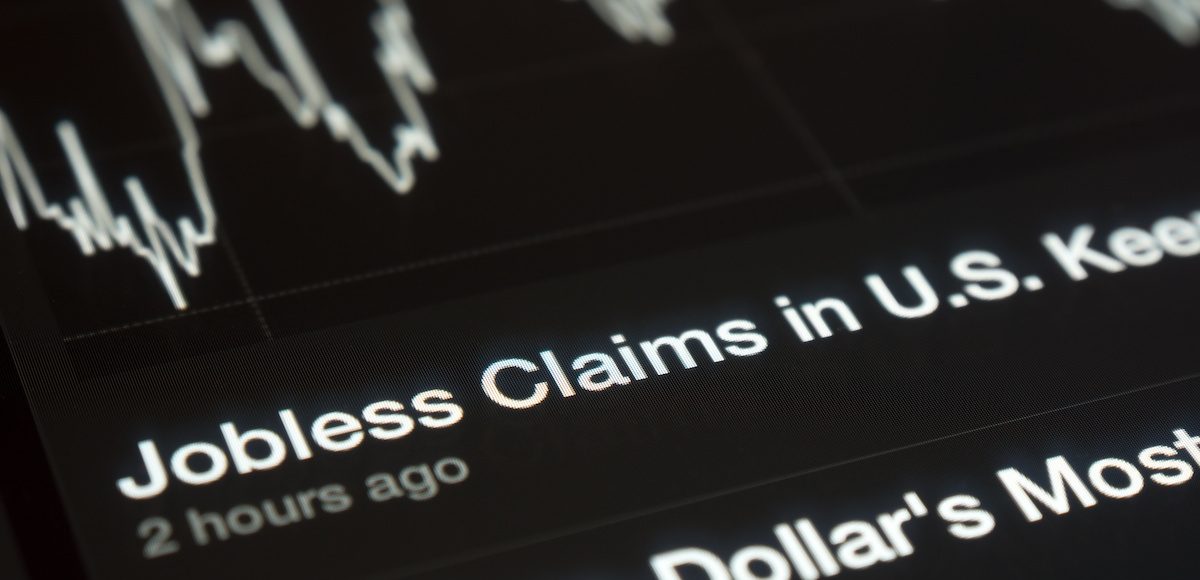
U.S. jobless claims graph on a tablet screen. (Photo: AdobeStock)

U.S. jobless claims graph on a tablet screen. (Photo: AdobeStock)

Initial jobless claims came in at a seasonally adjusted 210,000 for the week ending August 18, an unexpectedly but welcome decline of 2,000 from the previous week’s unrevised level of 212,000. The consensus forecast called for an increase of 3,000 to 215,000.

The 4-week moving average was 213,750, a decrease of 1,750 from the previous week’s unrevised average of 215,500.

In lagging data, the advance seasonally adjusted insured unemployment rate was unchanged at a very low 1.2% for the week ending August 11. The advance number for seasonally adjusted insured unemployment during the week ending August 11 fell to 1,727,000.

That’s a decrease of 2,000 from the previous week, which was revised up 8,000 from 1,721,000 to 1,729,000.

The 4-week moving average was 1,735,500, a decrease of 5,000 from the previous week’s revised average. The previous week’s average was revised up by 2,000 from 1,738,500 to 1,740,500.

The highest insured unemployment rates in the week ending August 4 were in New Jersey (2.5), Puerto Rico (2.3), Connecticut (2.2), Pennsylvania (2.0), Alaska (1.9), Rhode Island (1.9), California (1.8), Massachusetts (1.6), the Virgin Islands (1.6), and the District of Columbia (1.5).

The largest increases in initial claims for the week ending August 11 were in Georgia (+949), Michigan (+310), Connecticut (+259), South Carolina (+186), and Wisconsin (+171), while the largest decreases were in California (-1,243), Pennsylvania (-1,103), Iowa (-905), Texas (-617), and Kentucky (-460).

Initial jobless claims unexpectedly fell to a

On the left, supporters take a photo of President Donald Trump in Tampa, Florida, while businessman Mike Braun, right, thanks supporters after winning the Republican primary for U.S. Senate in Indiana. (Photos: PPD/AP)

On the left, supporters take a photo of President Donald Trump in Tampa, Florida, while businessman Mike Braun, right, thanks supporters after winning the Republican primary for U.S. Senate in Indiana. (Photos: PPD/AP)

President Donald Trump will head to Evansville, Indiana on Thursday to rally for Republican businessman Mike Braun. The rally, which will take place at The Ford Center at 7:00 pm CT, is the tenth rally that the president has held in The Hoosier State, ever.

“Today, we are announcing our next scheduled Make America Great Again rally on August 30 in Evansville, Indiana,” Michael Glassner, Chief Operating Officer for Donald J, Trump for President, Inc. told PPD in an email. “Evansville is a crossroads for so many great Americans in Indiana and the neighboring states, so it’s an ideal stop for President Trump’s next rally.”

The president is expected to tout his economic record and how it has benefited families in Indiana. He will also stress the importance for Hoosiers to get out and vote for Republican nominee Mr. Braun against vulnerable incumbent Democrat Joe Donnelly for the U.S. Senate.

Mr. Donnelly, who benefited from an extraordinarily weak Republican candidate in 2012, is one of — if not, these most — vulnerable Democratic incumbent up for reelection in the U.S. Senate. President Trump remains popular in his vice president’s home state, which he won 56.82% to 37.91%.

“The President is expected to report on the booming Trump economy that’s lifting up families across Indiana, his tough immigration and trade policies, his new EPA coal rules, and more,” Mr. Glassner added.

Mr. Braun, with the exception of attitude, shares much in common with the president. He’s a successful businessman and former Democrat, one of many Midwest workers and small business owners who left the Democratic Party during the era of Barack Obama.

“Most importantly, President Trump will remind Hoosiers of the need to get out and vote in midterm elections this fall to protect and expand the GOP majorities in the House and Senate, including supporting Mike Braun in his race against Joe Donnelly for the U.S. Senate.”

The race is rated Leans Republican on the PPD Election Projection Model.

President Donald Trump will head to Evansville,

In this Jan. 22, 2003 file photo, a Chinese shopkeeper stands behind a row of beef products at an open air market in Beijing, China. China will finally open its borders to U.S. beef while cooked Chinese poultry is closer to hitting the American market as part of a U.S.-China trade agreement. Trump administration officials hailed the deal as a significant step in their efforts to boost U.S. exports and even America's trade gap with the world's second-largest economy. (Photo: AP)

In this Jan. 22, 2003 file photo, a Chinese shopkeeper stands behind a row of beef products at an open air market in Beijing, China. China will finally open its borders to U.S. beef while cooked Chinese poultry is closer to hitting the American market as part of a U.S.-China trade agreement. Trump administration officials hailed the deal as a significant step in their efforts to boost U.S. exports and even America’s trade gap with the world’s second-largest economy. (Photo: AP)

The good news about China is that economic liberalization has produced impressive growth in recent decades, which has helped bring hundreds of millions of people out of poverty.

The bad news is that China started from such a low position that per-capita income is still quite low compared to rich nations.

So, what does the economic future hold? Will China continue its upward trajectory?

That’s certainly possible, but it depends on the Chinese government. Will there be additional liberalization, giving the economy more “breathing room” to grow?

Not if the government listens to the bureaucrats at the International Monetary Fund. I wrote three years ago about an IMF study that recommended huge tax increases in China.

And now there’s another IMF report pushing for big tax hikes. Only instead of arguing that higher taxes somehow will produce more growth by financing a bigger burden of government (which – no joke – was the core argument in the 2105 study), this new report claims higher taxes will produce more growth by reducing inequality.

Here’s the basic premise of the paper.

…economic growth has not benefited all segments of the population equally or at the same pace, causing income disparities to grow, resulting in a large increase in income inequality… This is especially of concern as the recent literature has found that elevated levels of inequality are harmful for the pace and sustainability of growth… The paper discusses what additional policies can be deployed to improve equity in opportunities and outcomes, with particular focus on the role for fiscal policy.

But a key part of the premise – the blanket assertion that inequality undermines growth – is junk.

As I noted in 2015 when debunking a different IMF study, “..they never differentiate between bad Greek-style inequality that is caused by cronyism and good Hong Kong-style inequality that is caused by some people getting richer faster than other people getting richer in a free market.”

Let’s dig into the details of this new IMF study.

Here’s the problem, at least according to the bureaucrats.

Income inequality in China today, as measured by the Gini coefficient, is among the highest in the world. …Furthermore, the Gini coefficient has rapidly increased over the last two decades, by a total of about 15 Gini points since 1990.

And here’s the chart that supposedly should cause angst. It shows that inequality began to rise as China shifted toward capitalism.

But why is this inequality a bad thing, assuming rich people earned their money honestly?

When markets are allowed to function, people become rich by providing value to the rest of us. In other words, it’s not a zero-sum game.

Ironically, the IMF study actually makes my point.

…much of China’s population has experienced rising real incomes. …even for the bottom 10 percent incomes rose by as much as 63 percent between 1980 and 2015… This has implied that China reduced the share of people living in poverty immensely. Measured by the headcount ratio, the population in poverty decreased by 86 percentage points from 1980 to 2013 (see figure 6), the most rapid reduction in history.

And here’s the aforementioned Figure 6, which is the data worth celebrating.

Any normal person will look at this chart and conclude that China should do more liberalization.

But not the bureaucrats at the IMF. With their zero-sum mentality, they fixate on the inequality chart.

Which leads them to make horrifyingly bad recommendations.

…several reforms could be envisaged to make fiscal policy more inclusive, both on the tax and expenditure side. …revenues from PIT contribute only around 5 percent of total revenues, a much lower share than the OECD average of 25 percent. Increasing the reliance on PIT, which more easily accommodates a progressive structure, could allow China to improve redistribution through the tax system. …While the PIT in China already embeds a progressive schedule with marginal rates increasing with income from 3 to 45 percent, …redesigning the tax brackets would ensure that middle and high income households with higher ability to pay contribute more to financing the national budget… Property and wealth taxes remain limited in China. Such taxes are broadly viewed as progressive, because high-income households usually tend also to have more property and wealth. …Consideration should therefore be given to adopt a recurrent market-value based property tax.

And why do IMF bureaucrats want all these additional growth-stifling taxes?

To finance a larger burden of government spending.

China still lags other emerging economies and OECD countries in public spending on education, health and social assistance. …social expenditure will need to be boosted.

In other words, the IMF is suggesting that China should copy welfare states such as Italy and France.

Except those nations at least enjoyed a lengthy period before World War II when government was very small. That’s when they became relatively rich.

The IMF wants China to adopt big government today, which is a recipe to short-circuit prosperity.

P.S. I don’t think the IMF is motivated by animus towards China. The bureaucrats are equal-opportunity dispensers of bad advice.

P.P.S. The OECD also is trying to undermine growth in China.

The IMF argues wealth inequality got worse

The National Association of Realtors (NAR) said existing home sales declined for the fourth straight month in July to the slowest pace in more than 2 years. The steady and solid gains in home prices — even coupled with low inventory — have reduced demand.

“Led by a notable decrease in closings in the Northeast, existing home sales trailed off again last month, sliding to their slowest pace since February 2016 at 5.21 million,” Lawrence Yun, NAR chief economist said. “Too many would-be buyers are either being priced out, or are deciding to postpone their search until more homes in their price range come onto the market.”

The median existing-home price for all housing types in July was $269,600, a gain of 4.5% from July 2017 ($258,100). The price increase for July marks the 77th straight month of year-over-year gains.

Total housing inventory at the end of the month was down 0.5% to 1.92 million existing homes available for sale. That’s unchanged from a year ago. Unsold inventory is at a 4.3-month supply at the current sales pace, also unchanged from a year ago.

Properties typically stayed on the market for 27 days in July, up from 26 days in June but down from 30 days a year ago. Fifty-five percent of homes sold in July were on the market for less than a month.

“Listings continue to go under contract in under month, which highlights the feedback from Realtors® that buyers are swiftly snatching up moderately-priced properties,” said Yun. “Existing supply is still not at a healthy level, and new home construction is not keeping up to meet demand.”

Regional Breakdown

Existing home sales in the Northeast — historically, the weak region — tumbled 8.3% to an annual rate of 660,000. They are 1.5% below a year ago. The median price in the Northeast was $309,700, which is up 6.8% from July 2017.

In the Midwest, existing-home sales fell 1.6% to an annual rate of 1.25 million in July, and are 0.8% below a year ago. The median price in the Midwest was $210,500, up 2.5% from a year ago.

Existing home sales in the South ticked down 0.4% to an annual rate of 2.24 million in July, and are 0.4% lower than a year ago. The median price in the South was $233,400, a gain of 2.7% from a year ago.

In the West, existing home sales increased 4.4% to an annual rate of 1.19 million in July, but are still 4.0% below a year ago. The median price in the West was $392,700, a gain of 5.1% from July 2017.

Existing home sales declined for the fourth

People's Pundit Daily
You have %%pigeonMeterAvailable%% free %%pigeonCopyPage%% remaining this month. Get unlimited access and support reader-funded, independent data journalism.

Start a 14-day free trial now. Pay later!

Start Trial