Widget Image
Follow PPD Social Media
Monday, January 13, 2025
HomeStandard Blog Whole Post (Page 2)

Consumption Indicators Fuel Modest Increase in CNFAI for January, But 3 of 4 Indicators Decreased
U.S. economy on an American flag background waving in the wind, in 3D rendering. (Photo: AdobeStock)

The Chicago Fed National Activity Index (CFNAI) indicated tepid economic growth in January, and growth for December was weaker than initially reported. The CFNAI came in +0.66 and the prior month was revised down from +0.52 to +0.41.

Forecasts ranged from a low of 0.39 to a high of 0.45. The consensus forecast was 0.40. While all of the broad indicators made positive contributions in January, three of the four deteriorated from December.

The CFNAI-MA3 — the three-month moving average — fell to +0.47 in January from +0.60 in December. The CFNAI Diffusion Index — also a three-month moving average — fell to +0.34 in January from +0.49 in December.

Fifty-three of the 85 individual indicators made positive contributions to the CFNAI in January, while 32 made negative contributions. Forty-nine indicators improved from December to January, while 36 indicators deteriorated.

However, of the indicators that improved, 13 made negative contributions. The increase in the Index was fueled by somewhat misleading consumer spending indicators. Personal consumption and housing category rose to +0.35 in January from –0.06 in December.

Employment-related indicators contributed +0.01 in January, down slightly from +0.05 in December. Meanwhile, nonfarm payrolls increased by 49,000, after falling by 227,000 in the previous month.

The U.S. Labor Department (DOL) reported initial jobless claims continued to rise for the week ending February 13 by 13,000 to a seasonally adjusted 861,000. The previous week was revised significantly higher by 55,000 from 793,000 to 848,000.

As People’s Pundit Daily (PPD) previously reported, a slew of key economic indicators took a turn for the worse following the election and inauguration of Joseph R. Biden. It’s a stark reversal from the historically positive trends that followed the election and inauguration of Donald J. Trump, and the recovery after the height of pandemic-induced lockdown.

The Chicago Fed National Activity Index (CFNAI)
Housing Indicators Were Crushing Pre-Pandemic Levels and Post-Pandemic Expectations Under Trump

U.S. housing market concept. (Photo: AdobeStock)

New York, N.Y. (PPD) — Economists said housing market indicators suggested the sector was “booming” before the election last November, but are already reversing historically high trends. Now, increased regulatory policy under a new administration are causing headwinds in new residential construction, the labor market and greater economy.

Housing indicators that were surpassing pre-pandemic levels and post-pandemic expectations only a few months ago, are already showing signs of weakening, and economists worry the boom will turn into a fizzle.

“Concerns over higher lumber prices produced softness for the housing market amid solid buyer traffic at the start of the year,” said NAHB Chairman Chuck Fowke. “With the cost of building materials rising at a rapid pace, the challenge for builders is to keep home prices at an affordable level for buyers even as the regulatory policy environment may become more challenging.”

The NAHB Housing Market Index (HMI) released earlier this week for February came in at 84. While that’s 1 point higher than the month prior, it’s a clear arrest in the trend that saw repeated and consecutive surpassing of historically highs under the Trump Administration.

For the first three years the prior administration, housing remained the only sector to not realize pre-Great Recession levels of activity. By the end of 2019 and start of 2020, it appeared the U.S. economy would be firing on all four cylinders.

The HMI started 2020 at a 20-year high. In January 2020, builder confidence in the market for newly-built single-family homes hit the highest sentiment levels since July of 1999. It would later far surpass those levels following the lockdowns due to Covid-19.

New residential construction, a key report on building permits and housing starts heavily influenced by builder confidence, had crushed forecasts in September and October. The last two months before the election were preceded by consistently strong monthly data that seemed immune to the lockdowns.

However, housing starts missed the consensus forecast and declined significantly in January to 1,580,000, down from 1,680,000. Further deepening concerns for future activity, delivery delays and costs slowed construction, meaning strong data for the prior month was probably driven by lagging activity.

“The weakness in housing starts in January is consistent with our recent builder surveys,” said NAHB Chief Economist Robert Dietz. “Builders report concerns over increasing lumber and other construction costs and delays in obtaining building materials.”

“Rising interest rates will also erode housing affordability in 2021, as existing home inventories remain low.”

By the end of 2020, experts foresaw housing leading the economic recovery and raised growth forecasts for the sector. While indicators suggest weaker activity post-election, some are still maintaining a positive outlook, albeit less positive.

“Pending home sales contracts have dipped during recent months, but I would attribute that to having too few homes for sale,” said Lawrence Yun, NAR’s chief economist. “There is a high demand for housing and a great number of would-be buyers, and therefore sales should rise with more new listings.”

However, that forecast could prove too rosy if other areas of the economy do not hold up as well as anticipated against more regulations, higher taxes and lower wages.

Housing Market Follows Other Sectors Into Weaker Trend

Housing is one sector in a slew of key economic indicators that took a turn for the worse following the election and inauguration of Joe R. Biden. It’s a stark reversal from the positive trends that followed the election and inauguration of Donald J. Trump, and the recovery after the height of pandemic-induced lockdown.

The NFIB Small Business Optimism Index cratered ahead of the inauguration of Joe Biden, the result of an anticipation of negative business conditions in 2021. NFIB Chief Economist Bill Dunkelberg said the 8-point decline from 101.4 to 95.9 — the first non-pandemic related large historical drop since the 2016 presidential election — “mostly” was “due to the outlook of sales and business conditions in 2021.”

“Small businesses are concerned about potential new economic policy in the new administration and the increased spread of COVID-19 that is causing renewed government-mandated business closures across the nation.”

The Index was one of several key economic indicators to break records following the passage of the Tax Cuts and Jobs Act (TCJA), the first overhaul to the tax code in 31 years. The new administration has promised to rollback the overhaul, which fueled nearly two years of uniterrupted monthly wage gains of at least 3% for the first time since before the Great Recession.

The Survey of Consumers preliminary reading on consumer sentiment for February fell from 79.0 to 76.2, far below the consensus forecast. The decline notably followed what consumers viewed to be the resolution of the 2020 U.S. presidential election. It was fueled almost exclusively from declining expectations among the working class, particularly households with incomes below $75,000.

The Consumer Sentiment Index was rebounding post-pandemic lockdown before the election, and hit a six-month high as recently as September. Now, the percentage mentioning income gains fell to just 17% among those in the bottom third, compared with 44% in the top income third.

Meanwhile, the U.S. Labor Department (DOL) reported initial jobless claims continued to rise for the week ending February 13 by 13,000 to a seasonally adjusted 861,000. The previous week was revised significantly higher by 55,000 from 793,000 to 848,000.

Economists said housing market indicators suggested the

Prior Unemployment Insurance Weekly Claims Revised Significantly Higher, Trend in Declining Insured Unemployment Rate Ends

U.S. initial jobless claims graph on a tablet screen. (Photo: AdobeStock)

Washington, D.C. (PPD) — The U.S. Labor Department (DOL) reported initial jobless claims continued to rise for the week ending February 13 by 13,000 to a seasonally adjusted 861,000. The previous week was revised significantly higher by 55,000 from 793,000 to 848,000.

Forecasts ranged from a low of 725,000 to a high of 822,000. The consensus forecast was 768,000. The 4-week moving average was 833,250, a decrease of 3,500, while the previous week’s average was revised up by 13,750 from 823,000 to 836,750.

The weekly unemployment insurance claims report is just one in a slew of key economic indicators that took a turn for the worse ahead of the inauguration of Joe Biden. It’s a stark reversal from the positive trends before and after the pandemic under Donald Trump.

The advance seasonally adjusted insured unemployment rate was unchanged at 3.2% for the week ending February 6. Post-Covid-19 shutdown, the insured unemployment rate first fell to single digits during the week ending August 15 at 9.9%.

Under the Trump Administration, this rate had fallen to an all-time low 1.1% and remained at 1.2% as recently as March 14. But that was before coronavirus (COVID-19) mitigation efforts.

The insured unemployment rate hit the first high of the current crisis at 8.2% for the week ending April 4. The all-time high prior to that was 7.0%, recorded in May of 1975. On April 11, it rose to 11.0% and 12.4% on April 25.

Worth noting, the most strictest lockdown states — which consequently saw the highest number of infections — were and are disproportionately hurting the labor market and overall economy. Lockdowns were ineffective but their impact on the labor markets have been grave, and had far-reaching impacts that reverberated in non-strict states.

The highest insured unemployment rates in the week ending January 30 were in the Virgin Islands (6.6), Alaska (6.4), Pennsylvania (6.4), Rhode Island (6.1), Nevada (6.0), Connecticut (5.3), Illinois (5.1), New York (5.1), New Mexico (5.0), and Massachusetts (4.9).

The advance number for seasonally adjusted insured unemployment during the week ending February 6 was 4,494,000, a decrease of 64,000 from the previous week’s revised level.

The previous week’s level was revised up 13,000 from 4,545,000 to 4,558,000. The 4-week moving average was 4,632,000, a decrease of 120,250 from the previous week’s revised average. The previous week’s average
was revised up by 3,500 from 4,748,750 to 4,752,250.

During the week ending January 30, Extended Benefits were available in the following 20 states and territories: Alaska, California, Connecticut, District of Columbia, Hawaii, Illinois, Massachusetts, Michigan, Nevada, New Jersey, New Mexico, New York, North Carolina, Oregon, Pennsylvania, Puerto Rico, Rhode Island, Texas, the Virgin Islands, and Washington.

The largest increases in initial claims for the week ending February 6 were in Ohio (+92,667), California (+28,688), Georgia (+5,171), Mississippi (+3,796), and Colorado (+3,045), while the largest decreases were in Florida (-47,430), New York (-17,407), Maryland (-16,585), Kansas (-12,376), and Arizona (-7,478).

Initial jobless claims continued to rise for

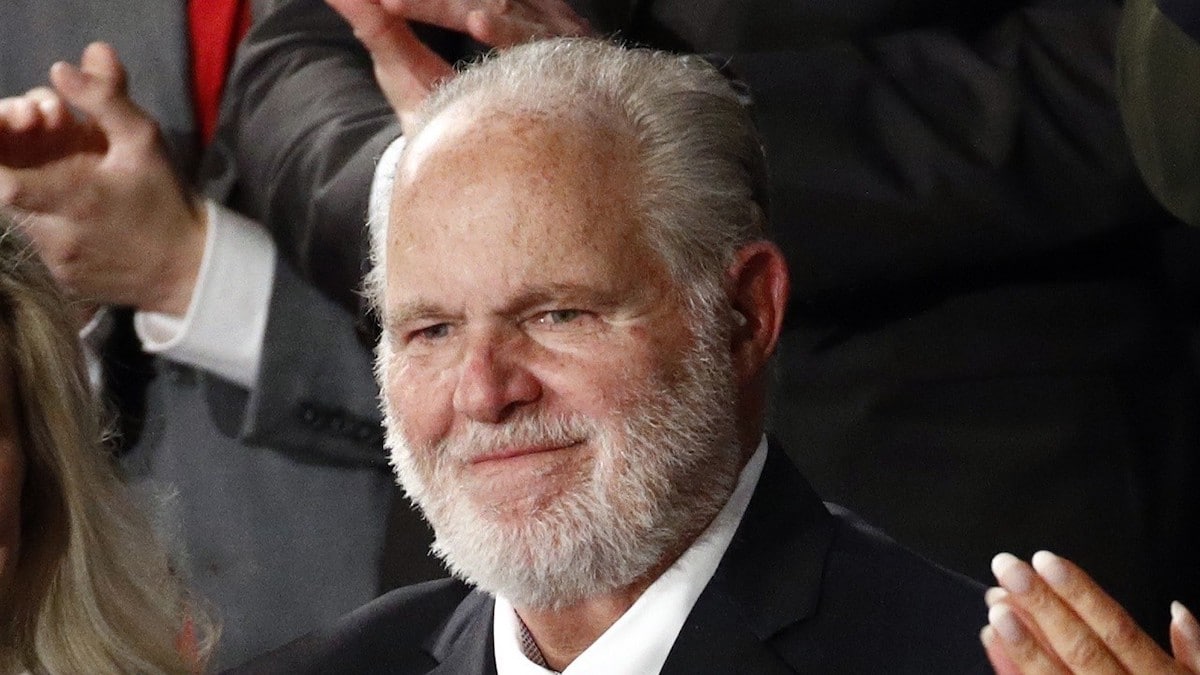
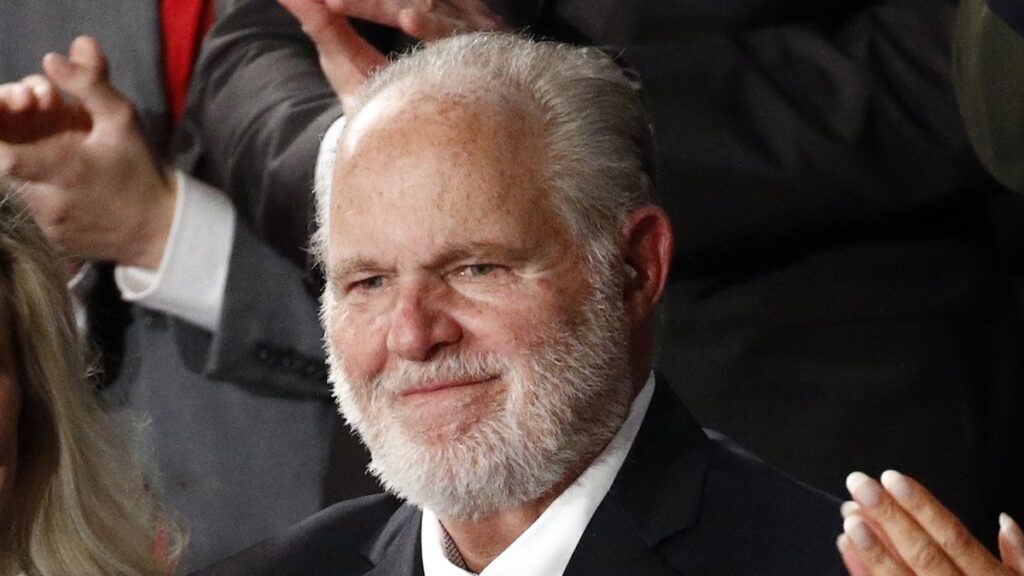
Rush Limbaugh stands for applause after receiving the Presidential Medal of Freedom from President Donald J. Trump during the State of the Union in January 2020.

Tampa, Fla. (PPD) — Rush Limbaugh, an unrivaled conservative icon and king of talk radio, died Wednesday morning at the age of 70 after a battle with lung cancer. He learned of his Stage IV lung cancer in January 2020 and days later was awarded the Presidential Medal of Freedom by President Donald J. Trump at the State of the Union.

“Losing a loved one is terribly difficult, even more so when that loved one is larger than life,” Kathryn, his wife, said during the announcement on the show. “Rush will forever be the greatest of all time.”

“He loved you, and he loved this radio show with every part of his being.”

“The Rush Limbaugh Show” began in 1988, and from behind the Golden EIB (Excellence in Broadcasting) Microphone he became one of the most influential media figures in American history. What started as a nationally syndicated show with only 56 radio stations, grew to air on more than 600 stations. It was the most listened-to radio show in the country, with more than 27 million people tuning in on a weekly basis.

“I wasn’t expected to be alive today,” Mr. Limbaugh said in his final broadcast of 2020. “I wasn’t expected to make it to October, and then to November, and then to December. And yet, here I am, and today, got some problems, but I’m feeling pretty good today.”

Tributes have been pouring in from conservatives, celebrities and media figures on social media. The 45th President of the United States praised his friend and supporter during a phone interview on Fox News.

“He was very brave,” President Trump said with a sorrowful tone. “He was fighting till the very end. He was a fighter and just a great gentleman.”

“Rush is irreplaceable, unique.”

Bo Snerdley, longtime friend and producer of “The Rush Limbaugh Show”.

Rush Limbaugh, an unrivaled conservative icon and

Manufacturing Export Wooden Crate, reading Made in New York. 3D Illustration. (Photo: AdobeStock)

New York, N.Y. (PPD) — The Federal Reserve Bank of New York Empire State Manufacturing Survey rebounded modestly in February to 12.1, beating the consensus forecast. The headline general business conditions index climbed to the highest level in three months.

Prior to the election, the Empire State Manufacturing Survey was showing signs of greater-than-expected growth, tripling the forecast. It slowed immediately after the election.

The Federal Reserve Bank of New York

Shop closed due to coronavirus outbreak and woman looking at her mobile device and wearing a surgical mask. (Photo: AdobeStock)

Ann Arbor, Mich. (PPD) — The Survey of Consumers preliminary reading on consumer sentiment for February fell from 79.0 to 76.2, far below the consensus forecast. The decline since the resolution of the 2020 U.S. presidential election comes almost exclusively from declining expectations for the future among the working class, particularly households with incomes below $75,000.

Forecasts for the headline index ranged from a low of 79.5 to a high of 82.1. The consensus forecast was 80.9. The Consumer Sentiment Index was rebounding post-pandemic lockdown before the election, and hit a six-month high as recently as September.

“Households with incomes in the bottom third reported significant setbacks in their current finances, with fewer of these households mentioning recent income gains than anytime since 2014,” Richard Curtain, Chief Economist at Survey of Consumers, said.

The percentage mentioning income gains fell to just 17% among those in the bottom third, compared with 44% in the top income third. Put plainly, the rich feel as if they’re getting richer, while the working class feel their economic status weakening.

“When asked to assess their current financial position, the deep divisions become apparent: among those with incomes in the bottom third, just 23% reported improved finances, the lowest since 2014; in contrast, among those with incomes in the top third, 54% reported their finances had improved.”

The Survey of Consumers preliminary reading on

Weekly Unemployment Insurance Claims Far Worse than Forecast as Businesses Prepare for Negative Environment

Closeup view of a business man cutting a piece of paper with the word jobs written on it, concept for job cut reports. (Photo: AdobeStock)

Washington, D.C. (PPD) — The U.S. Labor Department (DOL) reported initial jobless claims soared by 181,000 to a seasonally-adjusted 965,000 for the week ending January 9. The previous week was revised down only slightly by 3,000 from 787,000 to 784,000.

Forecasts ranged from a low of 775,000 to a high of 835,000. The consensus forecast was 790,000. The 4-week moving average was pushed up to 834,250, an increase of 18,250 from the previous week. The previous week’s average was revised down by 2,750 from 818,750 to 816,000.

The weekly unemployment insurance claims report is just the latest in a slew of key economic indicators taking a turn for the worse ahead of the inauguration of Joe Biden. It’s a stark reversal from the positive trends before and after the pandemic under Donald Trump.

Lagging Jobless Claims Data

The advance seasonally adjusted insured unemployment rate came in at 3.7% for the week ending January 2, an increase of 0.2 from the previous week’s unrevised rate. Post-Covid-19 shutdown, the insured unemployment rate first fell to single digits during the week ending August 15 at 9.9%.

Under the Trump Administration, this rate had fallen to an all-time low 1.1% and remained at 1.2% as recently as March 14. But that was before coronavirus (COVID-19) mitigation efforts.

The insured unemployment rate hit the first high of the current crisis at 8.2% for the week ending April 4. The all-time high prior to that was 7.0%, recorded in May of 1975. On April 11, it rose to 11.0% and 12.4% on April 25.

Worth noting, the most strictest lockdown states — which consequently saw the highest number of infections — were and are disproportionately hurting the labor market and overall economy. Lockdowns were ineffective but their impact on the labor markets have been grave, and had far-reaching impacts that reverberated in non-strict states.

The highest insured unemployment rates in the week ending December 26 were in Pennsylvania (6.6), Alaska (6.5), Kansas (6.4), New Mexico (5.9), Illinois (5.6), Washington (5.6), Nevada (5.5), the Virgin Islands (5.3), Minnesota (5.2), and California (5.0).

With more strict measures expected under a Biden Administration, employers are clearly cutting jobs, not creating them. As was evident in the most recent NFIB Small Business Optimism Index, firms anticipate unfriendly business conditions.

The advance number for seasonally adjusted insured unemployment during the week ending January 2 was 5,271,000, an increase of 199,000 from the previous week’s unrevised level of 5,072,000. The 4-week moving average was 5,215,750, a decrease of 59,000 from the previous week’s unrevised average of 5,274,750.

The largest increases in initial claims for the week ending January 2 were in Louisiana (+17,119), Kansas (+15,400), Texas (+14,541), Georgia (+12,498), and Washington (+10,950), while the largest decreases were in Illinois (-65,099), California (-7,743), Maryland (-2,088), and Florida (-1,836).

Jobless claims soared 181,000 for January 9,

Small Business Optimism Falls Below Historic Average for First Time Since 1973 After Record-Setting Run Under Trump

Closed small businesses for coronavirus (COVID-19) pandemic, closure sign on retail store window banner background. (Photo: AdobeStock)

The National Federation of Independent Business (NFIB) Small Business Optimism Index cratered ahead of the inauguration of Joe Biden, the result of an anticipation of negative business conditions in 2021. The 8-point decline from 101.4 to 95.9 is the first non-pandemic related large historical drop since the election of Donald J. Trump in November 2016, and comes after a post-lockdown rebound.

“This month’s drop in small business optimism is historically very large, and most of the decline was due to the outlook of sales and business conditions in 2021,” said NFIB Chief Economist Bill Dunkelberg. “Small businesses are concerned about potential new economic policy in the new administration and the increased spread of COVID-19 that is causing renewed government-mandated business closures across the nation.”

The Small Business Optimism Index has now fallen below the average value since 1973 of 98. Nine of the 10 Index components declined and only one improved. The percentage of owners expecting better business conditions over the next six months declined 24 points to a net negative 16%.

The percent of small business owners thinking it’s a good time to expand fell 4 points to 8% and sales expectations over the next three months tanked 14 points to a net -4%. Earnings trends over the past three months also fell 7 points to a net negative, with a -14% reporting higher earnings.

Small business closed business due to the lockdowns to mitigate the spread of Coronavirus (COVID-19). An unidentified person wearing a mask hangs a closed sign on the front door. (Photo: AdobeStock)

Seasonally adjusted, a net -2% of all small business owners reported higher nominal sales in the past three months, a decline of 7 points from November. The net percent of owners expecting higher real sales volumes cratered 14 points to a net -4%.

Under the Trump Administration, small business optimism set numerous records. Only one year after the election of the soon-to-be one-term president, it soared just below the all-time high set in 1983.

It was one of several key economic indicators to break records following the passage of the Tax Cuts and Jobs Act, the first overhaul to the tax code in 31 years. The National Association of Manufacturers (NAM) that same month reported manufacturers’ optimism in the fourth quarter (4Q) of 2017 was the highest in the 20-year history of the Manufacturers’ Outlook Survey.

In September 2018, small business optimism broke the all-time high for the first time.

Now, the net percentage of owners reporting rising inventory fell 2 points to a net -6%. The net percent of owners viewing current inventory stocks as too low rose 2 points to 7%, a record high that indicates declining economic activity.

The NFIB Small Business Optimism Index cratered

Trump: $900 Billion “Covid Relief” Bill “Has Almost Nothing to Do With Covid”

Washington, D.C. (PPD) — President Donald Trump slammed the so-called Covid relief bill for “ridiculously low” payments to Americans and “wasteful spending” on foreign countries, lobbyists and special interest. The $900 billion behemoth is roughly 5,000 pages and largely passed on a bipartisan basis.

It provides larger payments to illegal residents, billions in foreign aide and rents to K Street. The president ripped members of both parties for passing the bill without reading it.

“Throughout the summer Democrats cruelly blocked Covid relief legislation in an effort to advance their extreme leftwing agenda and influence the election,” President Trump said, adding the new version contains little relief for working Americans and small business.

“It’s called the Covid relief bill, but it has almost nothing to do with Covid.”

Foreign Assistance in Covid Relief Bill

  • $85.5 million for assistance to Cambodia,
  • $134 million to Burma,
  • $1.3 billion for Egypt and the Egyptian military, which will go out and buy almost exclusively Russia military equipment.
  • $25 million for democracy and gender programs in Pakistan,
  • $505 million to Belize, Costa Rica, El Salvador, Guatemala, Honduras, Nicaragua and Panama,
  • $40 million for the Kennedy Center in Washington, D.C., which is not even open for business;
  • $1 billion for the Smithsonian, plus an additional $154 million for the National Gallery of Art. Likewise, these facilities are essentially not open.

Waste in Covid Relief Bill

  • $7 million for reef fish management,
  • $25 million to combat Asian carp,
  • $2.5 million to count the number of amberjack fish in the Gulf of Mexico,
  • Provision to promote the breeding of fish in federal hatcheries,
  • $3 million in poultry protection technology,
  • $2 million to research the impact of downed trees;
  • $566 million for construction projects at the FBI.
A graphic concept of the coronavirus on a yellow police tape against the backdrop of the Capitol Building in Washington DC. (Photo: AdobeStock)

“The bill also allows stimulus checks for the families of illegal aliens, allowing them to get up to $1,800 each,” the president rightly noted. “This is far more than the Americans are given.”

The year-end omnibus spending bill was more a combined package that included a coronavirus stimulus bill in other appropriations. After failing to come to an agreement throughout the summer due to political maneuvering before the election, the U.S. Congress rushed to get out of Washington, D.C., for the Christmas break.

The funding package for Commerce, Justice, Defense, Treasury, Homeland Security, and other federal components, was previously negotiated in Congress. Lawmakers finally came to an agreement on the coronavirus portion over the weekend. They combined the two bills to allow them to get it done in one vote, providing both political cover for bad votes and an easy out before the break.

But President Trump is not having it, and demanding changes in the eleventh hour.

“Despite all of this wasteful spending and much more, the $900 billion package provides hardworking taxpayers with only $600 in relief payments, and not enough money is given to small businesses, and in particular restaurants whose owners have suffered so grievously.” They were only given a deduction for others to use in business for two years. This two year period must be withdrawn to allow owners to obtain financing and get their restaurants back in condition. Congress found plenty of money for foreign countries, lobbyists and special interest while sending the bare minimum to the American people who need it. It was not their fault. It was China’s fault.”

H.R. 133, or the Consolidated Appropriations Act, 2021 [Including Coronavirus Stimulus & Relief], passed with 359 Yeas to 53 Nays. Of the Nays, 50 were Republican. In the U.S. Senate, it passed with 92 Yeas to 6 Nays. All 6 Nays were Republican.

“I’m asking Congress to amend this bill and increase the ridiculously low $600 to $2,000, or $4,000 for a couple,” he said. “I’m also asking Congress to immediately get rid of the wasteful and unnecessary items from this legislation, and to send me a suitable bill or else the next administration will have to deliver a package, and maybe that administration will be me.”

Under pressure, House Democrats are now planning to force a vote this week on increasing the size of the stimulus checks from $600 to $2,000 per adult, as the president demanded. Leadership in both the House and Senate signaled they would support the demand, although attempted to rewrite history.

“I’m in. Whaddya say, Mitch?” Senate Minority Leader Chuck Schumer tweeted. “Let’s not get bogged down with ideological offsets and unrelated items and just DO THIS! The American people deserve it.”

“At last, the president has agreed to $2,000,” House Speaker Nancy Pelosi wrote on Twitter. “Democrats are ready to bring this to the floor this week by unanimous consent. Let’s do it!”

Worth noting, the president repeatedly stated he supported at least $1,200. Democrats simply refused to take up the relief bill before the election, hoping to hurt the president’s prospects at re-election in November.

President Trump slammed the Covid relief bill

Reliable Being the Key Word; Accurate Polling Warns of Election Integrity Crisis

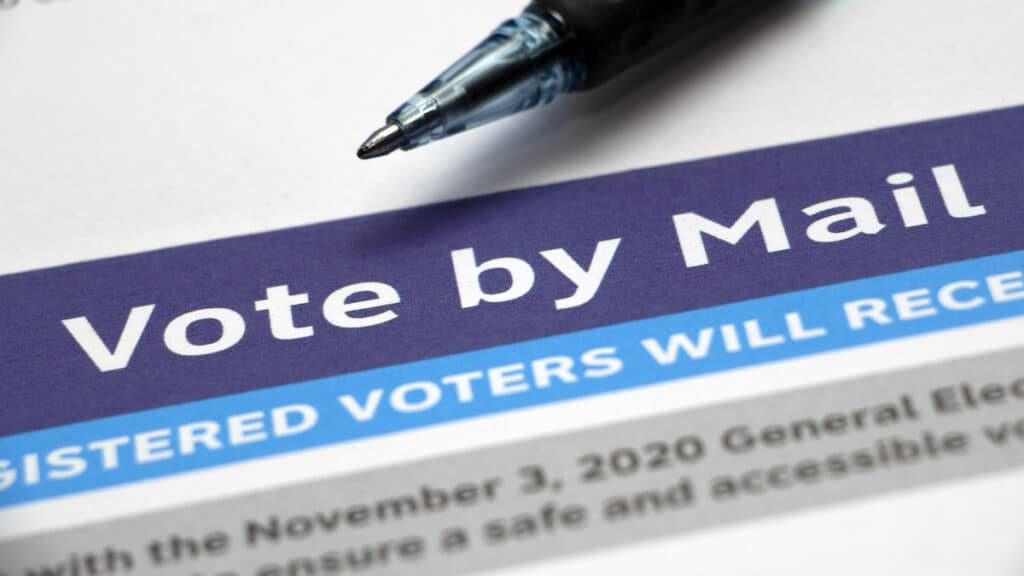
Pen on paper with Vote by Mail heading and the text "registered voters will receive" an absentee ballot or request for the U.S. election on November 3, 2020. (Photo: AdobeStock)
Pen on paper with Vote by Mail heading and the text “registered voters will receive” an absentee ballot or request for the U.S. election on November 3, 2020. (Photo: AdobeStock)

Reliable polls conducted before and after the election show voters do not trust vote-by-mail, and understand the likelihood of it leading to an increase fraud.

The Inside The Numbers™ Election 2020 Public Polling Project conducted by Big Data Poll released polling in six battleground states and was within the sampling error juxtaposed to actual results. That track record makes the project — which was funded solely by podcast viewers — among the most accurate this cycle, if not the most accurate.

Surveys asked specifically about voters’ trust or lack-thereof in the integrity of the election given various changes to the electoral process, to include the expansion of vote-by-mail.

In Arizona, a state in which vote-by-mail has historically represented roughly 8 in 10 of the total statewide vote, polling conducted from October 16 to 20 found nearly half of all likely voters had either “not very much” (29.5%) confidence or none at all (17.4%).

In Florida, another state in which vote-by-mail or absentee ballot voting has been common for years, polling conducted from September 26 to 27 also found nearly half of all likely voters had either “not very much” (28.0%) confidence or none at all (17.8%).

Worth noting, in states where vote-by-mail was not prominently used, the statistical difference in confidence was small, but worse nevertheless. In Pennsylvania, slightly larger percentages had “not very much” confidence (29.0%) or “none at all” (18.2%) versus other states.

That story read the same all over the battlegrounds and even nationally earlier on during the cycle. The Epoch Times National Poll conducted by Big Data Poll from August 26 to August 30 found more than 4 in 10 had either “not very much” (21.2%) confidence or none at all (21.9%).

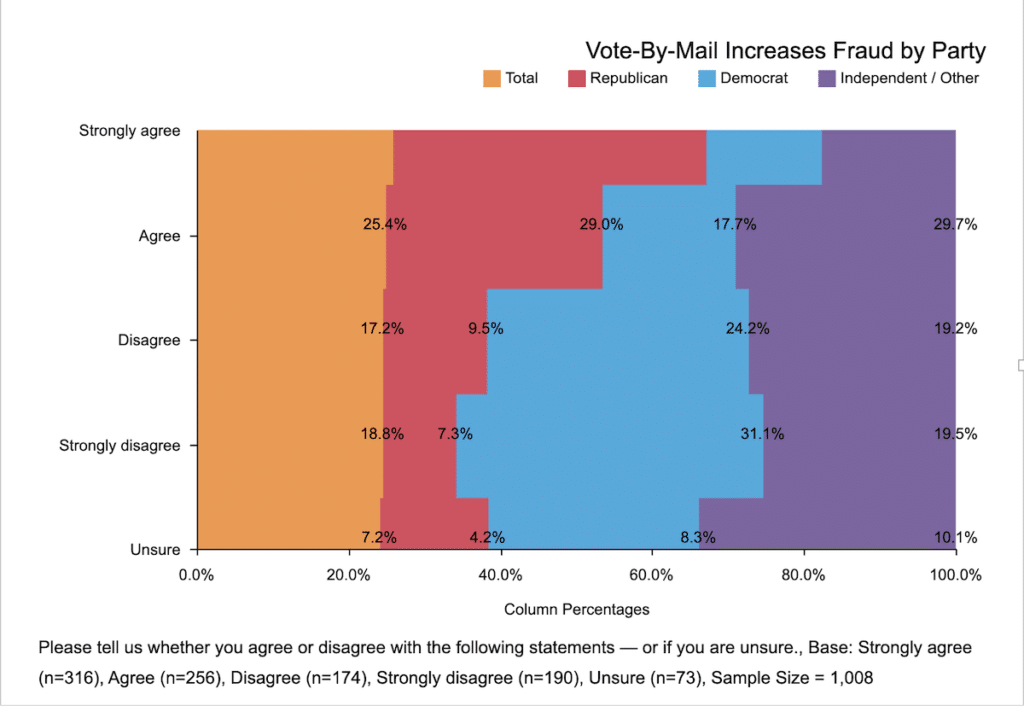
Please tell us whether you agree or disagree with the following statements — or if you are unsure. (Source: Big Data Poll)

The Peach State Battleground Poll recently conducted by Big Data Poll from December 4 to December 11 finds a solid majority (56.8%) agree “vote-by-mail is at least somewhat likely to increase fraud”, including 31.4% who “strongly agree”. While Republicans (79.0%) and Independent/Other voters (50.2%) are more likely to either strongly agree or agree that vote-by-mail increases fraud, more than 1 in 4 Democrats (26.3%) believe it, as well.

More than 4 in 10 think election officials in Georgia and elsewhere “looked the other way and counted ballots with mismatched signatures”.

(An earlier version of this article stated “4 in 10 Democrats” instead of “more than 1 in 4”. It has been corrected.)

Reliable polls conducted before and after the

People's Pundit Daily
You have %%pigeonMeterAvailable%% free %%pigeonCopyPage%% remaining this month. Get unlimited access and support reader-funded, independent data journalism.

Start a 14-day free trial now. Pay later!

Start Trial