Widget Image
Follow PPD Social Media
Saturday, February 1, 2025
HomeStandard Blog Whole Post (Page 240)

A waitress serves a steak and fried shrimp combo plate to a customer at Norms Diner on La Cienega Boulevard in Los Angeles, California May 20, 2015. (Photo: Reuters)

A waitress serves a steak and fried shrimp combo plate to a customer at Norms Diner on La Cienega Boulevard in Los Angeles, California May 20, 2015. (Photo: Reuters)

The Institute for Supply Management (ISM) non-manufacturing index (NMI) shows the U.S. service sector grew at a faster than expected pace in February. The NMI came in at 59.5% for the month, easily beating the 58.8 median forecast.

“The non-manufacturing sector reflected the second consecutive month of strong growth in February,” Anthony Nieves, Chair of the ISM Non-Manufacturing Business Survey Committee. “The decrease in the Employment Index possibly prevented an even stronger reading for the NMI composite index.”

“The majority of respondents’ continue to be positive about business conditions and the economy.”

The Non-Manufacturing Business Activity Index increased to 62.8%, 3 percentage points higher than the January reading of 59.8%, reflecting growth for the 103rd consecutive month, at a faster rate in February.

The New Orders Index registered 64.8%, 2.1 percentage points higher than the reading of 62.7% in January. The Employment Index decreased 6.6% in February to 55 percent from the January reading of 61.6%. The Prices Index decreased by 0.9% from the January reading of 61.9% to 61%, suggesting prices increased in February for the 24th consecutive month.

The 16 non-manufacturing industries reporting growth in February — listed in order — are:

  • Educational Services;
  • Transportation & Warehousing;
  • Utilities;
  • Real Estate, Rental & Leasing;
  • Wholesale Trade;
  • Finance & Insurance;
  • Management of Companies & Support Services;
  • Professional, Scientific & Technical Services; Health Care & Social Assistance;
  • Other Services; Construction;
  • Mining; Public Administration;
  • Retail Trade;
  • Agriculture, Forestry, Fishing & Hunting; and Information.

The two industries reporting contraction in February are:

  • Arts, Entertainment & Recreation; and
  • Accommodation & Food Services.

WHAT RESPONDENTS ARE SAYING…

  • “Lumber-related costs continue to increase as supply is also starting to become a problem. The market volatility of construction materials and the short supply of construction labor have added difficulty to long-term planning.” (Construction)
  • “Slight increase in activity; beginning to see some higher cost for goods and services.” (Finance & Insurance)
  • “Overall, [a] very positive outlook. Employment is low, and prices are up.” (Health Care & Social Assistance)
  • “Price of oil is increasing, which will have a trickle-down effect on our business. As the major oil and gas companies increase their activity, our business will increase with a bit of a lag.” (Mining)
  • “Class-A driver shortage is causing an escalation in the cost of both inbound and outbound logistics, which is increasing our cost of goods.” (Accommodation & Food Services)
  • “Optimistic outlook due to GDP and tax breaks, tempered by stock market instability.” (Professional, Scientific & Technical Services)
  • “Business outlook is picking up momentum due to the state of the stock-market and recent tax breaks. More investment into corporation CapEx funds.” (Retail Trade)
  • “Domestic transportation is still a challenge with slower than normal transit times. Both intermodal and over-the-road carriers are struggling [with] the electronic data logs (ELDs) now required on all tractors.” (Wholesale Trade)
  • “Lack of consistent government funding is decreasing spend across the Federal government.” (Public Administration)

The Institute for Supply Management (ISM) non-manufacturing

South Africa's Finance Minister Malusi Gigaba looks on as he speaks during the Thomson Reuters economist of the year awards in Sandton, South Africa July 13, 2017. (Photo: Reuters)

South Africa’s Finance Minister Malusi Gigaba looks on as he speaks during the Thomson Reuters economist of the year awards in Sandton, South Africa July 13, 2017. (Photo: Reuters)

There’s an easy way to judge whether countries have good economic policy or bad economic policy. Simply look at the Fraser Institute’s Economic Freedom of the World and check out a nation’s absolute score as well as how it ranks relative to other nations.

The EFW report even allows readers to see how nations score in the five major policy areas the are used to produce the overall grade. These categories are:

  • Size of Government – A measure of the burden of taxes and spending.
  • Regulation – A measure of intervention and red tape.
  • Sound Money – A measure of monetary stability and financial freedom.
  • Freedom to Trade Internationally – A measure of liberty to engage in cross-border commerce.
  • Legal System and Property Rights – A measure of the quality of governance.

This last category sometimes doesn’t get enough attention. I sometimes refer to it as the rule-of-law measure. It’s basically a way of trying to estimate whether government is doing a good job with institutional public goods. The variables used include 1) Judicial independence, 2) Impartial courts, 3) Protection of property rights, 4) Military interference in rule of law and politics, 5) Integrity of the legal system, 6) Legal enforcement of contracts, 7) Regulatory costs of the sale of real property 8) Reliability of police, and 9) Business costs of crime.

Let’s look today at property rights. And I’m motivated to address this issue because of some horrifying news from South Africa. The Wall Street Journal opined on the issue this morning.

No country ever became rich through its government’s seizure of private property (exhibit A: the Soviet Union), but politicians in South Africa want to give it another go. That’s the disheartening news from Cape Town this week, where the National Assembly voted 241-83 on Tuesday to start a process to amend the constitution and allow land expropriation without compensation.

When I saw the headline and read the opening paragraph, my initial instinct was “so what?” After all, the whites probably stole the land from the blacks in the first place.

But then I found out that issue already has been handled.

Post-apartheid, the government bought land and offered compensation to South Africans whose property had been forcibly seized after 1913. Many of those claims are now settled… According to a 2016 Institute of Race Relations survey, less than 1% of South Africans think land is one of the country’s “serious unresolved problems.” Unemployment, public services, housing and crime rank far higher.

What’s actually happening is hard-core leftist populism. And it may turn South Africa into another Zimbabwe.

Julius Malema of the far-left Economic Freedom Fighters party…believes the state should be the “custodian” of the nation’s property… His party says the expropriation “should apply to all South Africans, black and white.”

Huh? Stealing property from everybody, regardless of race, while calling your party Economic Freedom Fighters?!?

I guess their idea of freedom means freedom to loot, which is sometimes called – rather perversely – positive liberty. But I shouldn’t laugh too hard because the United States actually had a president with the same twisted mindset.

In any event, the WSJ reminds us that this won’t produce good results.

The idea is likely to duplicate the awful experience of Zimbabwe during the Robert Mugabe era, a case study in the reality that bureaucrats can’t distribute resources more efficiently or productively than private markets. Mugabe’s confiscations spooked investors, the agricultural industry collapsed, and a once prosperous country became known for hyperinflation and poverty. …the ruling African National Congress is supporting the measure to distract attention from its own failed statist economic policies, which have produced subpar growth and denied opportunity to poor South Africans. …South Africa needs more capital, more investment and a favorable business environment. Seizing private property has produced misery everywhere it has been tried.

This is very troubling, especially since South Africa, compared to other nations on the continent, maintained semi-decent policies after dismantling the racist apartheid regime.

wrote back in 2014 about South African economic policy and shared data about the nation’s EFW score. I was worried about the trend, and I’m now even more pessimistic.

Since today’s topic is property rights, let’s look at the global scores from the International Property Rights Index, which is published each year by the Property Rights Alliance.

As you can see, South Africa currently is in the second quintile. Best score of any African country, and above some European nations as well.


But if the South African constitution is changed and land expropriation is allowed, it’s a foregone conclusion that the country will suffer a precipitous fall in the rankings.

And here’s the map accompanying the study. The bottom line is that blue is good and purple/maroon (or whatever that color is…mauve?) is bad.


Switching to other nations, notice that all the Nordic nations are highly ranked. Indeed, they hold three of the top five slots. No wonder they score highly in that part of Economic Freedom of the World. Moreover, they also get very good scoresf or monetary policy, regulatory policy, and trade policy. Which explains why their economies get decent performance notwithstanding very bad fiscal policy.

And I’m certainly not surprised that New Zealand has the top spot.

The United States also does reasonably well. Not in the top 10, but at least in the top quintile.

As the Fraser Institute’s Economic Freedom of the

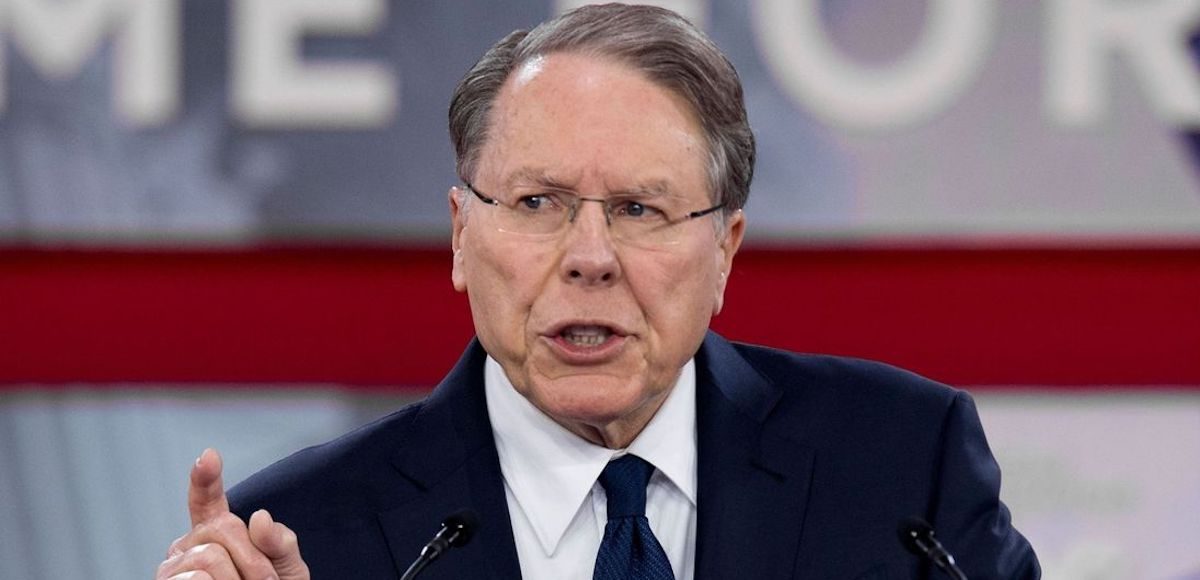
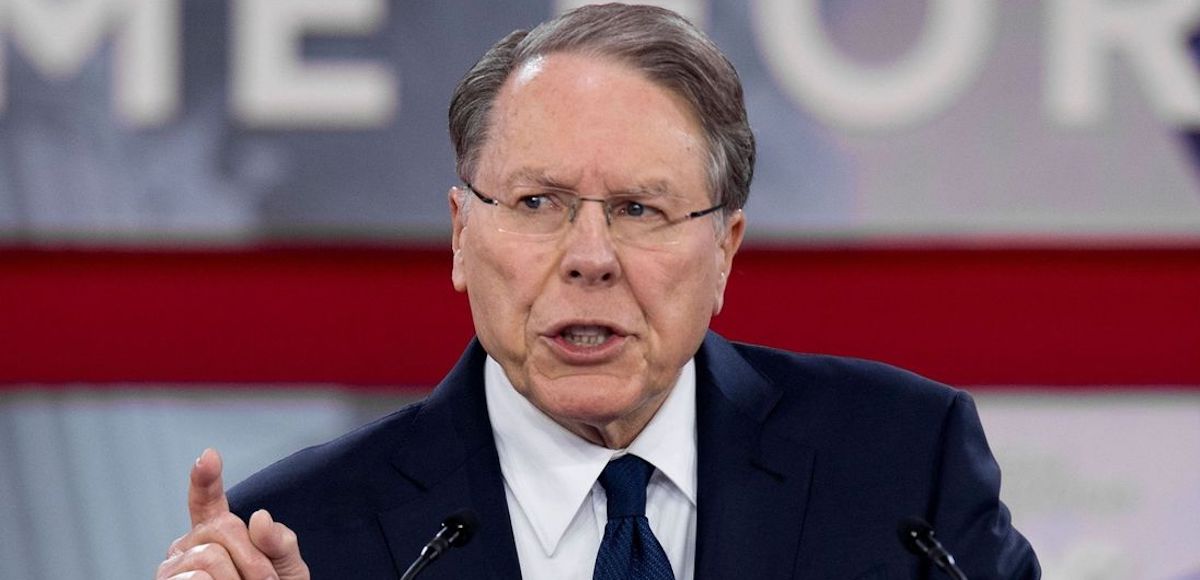
National Rifle Association (NRA) President Wayne LaPierre speaks at the Conservative Political Action Conference (CPAC) at National Arbor Maryland in February 2018.

The Washington Post Fact Checker recently distorted the role the National Rifle Association (NRA) played in the National Instant Criminal Background System (NICS). They obfuscated and omitted key details to inaccurately portray the gun rights group as unjustifiably taking credit for the background check system currently in place.

The not-so veiled insinuations are all meant to support the claim that the NRA did not support NICS and do not support making it stronger. That claim is false.

Fact Checker wrote that “after President Bill Clinton signed the Brady law in 1993, the NRA argued that the whole thing — including the NICS — should be struck down as unconstitutional.”

“The NRA’s love-hate relationship with the NICS database is something to behold,” they wrote. “The group once fought to strike down the law that created the database. Failing that, the NRA still managed to defang one of the law’s provisions.”

This is textbook obfuscation.

The Brady Act should be understood as two separate measures, one with an interim provision for background checks and another with a permanent provision. The NICS database was established by the latter and the NRA supported those efforts.

However, they did oppose the interim provision, which imposed a simple waiting period with a federal mandate to the States to conduct background checks only on handgun buyers. They supported the NICS established in the permanent provision because they believed the FBI, not State law enforcement authorities, should conduct background checks and, not just for the purchase of handguns, but for all firearms.

They demanded the wait period in the temporary provision be replaced by instant background checks at the point of sale once that technology was available. Their argument was a Tenth Amendment argument and their collective support was always for a more expansive background check system than the one set up by the temporary provision in the Brady Act.

We urge you to read the amicus brief filed by the NRA in the U.S. Court of Appeals for the Ninth Circuit, for yourself. There is no mention of the NICS, at all. While they did “fail in that” particular aim, the U.S. Supreme Court eventually agreed with the NRA in Sheriff Jay Printz v. U.S. (1997) that the federal mandate to local authorities was a violation of the Tenth Amendment.

The High Court ruled that Congress could not draft the States, only offer financial incentives to report the records of criminals and mentally ill people who shouldn’t purchase firearms.

They supported and believed in the constitutionality of the NICS because it’s run by the FBI, which Congress has authority over. They also have long argued that Congress has power to offer financial assistance to States to establish a system to report criminal convictions, which they’ve fought to expand into mental and other forms of disabilities that disqualify an individual from being able to obtain a firearm.

The NRA supported the NICS Improvements Act of 2007 in an effort to do just that.

What the Washington Post Fact Checker forgot to mention is that both political parties have repeatedly agreed to expand NICS to include mental health records. As People’s Pundit Daily (PPD) and others have examined, NRA-supported solutions would’ve had a far greater impact on the prevention of mass shootings than stricter gun control measures supported by their enemies.

As NRA President Wayne LaPierre recently reminded everyone at the Conservative Political Action Conference (CPAC), politicians have given them their word on these measures. They, not the NRA, have gone back on their word and have failed to act.

Rather than take ownership of those failures, they’ve chosen instead to scapegoat a Second Amendment-respectiving group that’s actually done quite a bit to enhance public safety. And their water-carriers in Big Media, such as the Washington Post Fact Checker, let them get away with it instead of doing their job.


The Washington Post Fact Checker did not

Consumer Spending and Consumer Sentiment. (Photo: AP)

Consumer Spending and Consumer Sentiment. (Photo: AP)

The Survey of Consumers, a closely-watched gauge of consumer sentiment, came in at a final reading of 99.7, the second highest level since 2004 and slightly better than the 99.5 median forecast.

The Current Economic Conditions subindex came in at 114.9, while the Index of Consumer Expectations came in at 90.0. American consumers are beginning to feel the economic rebound under the Trump Administration and impact of the Tax Cuts and Jobs Act (TCJA).

“Consumers based their optimism on favorable assessments of jobs, wages, and higher after-tax pay,” said Richard Curtain, Chief Economist of the Survey of Consumers. “The highest proportion of households since 1998 reported that their finances had improved compared with a year ago and anticipated continued gains during the year ahead.”

The strength in the Survey of Consumers mirrors the Consumer Confidence Index released on Tuesday. The Conference Board said consumer confidence soared in February to 130.8 (1985=100), up from 124.3 in January and hitting a new 18-year high. The respondents also cited the TCJA.

The Bureau of Economic Analysis (BEA) also earlier this week said wages are growing at a faster-than-expected pace due to the tax overhaul. The Personal Income and Outlays report showed Americans are definitely feeling the increase in their paychecks.

While the BEA said consumer spending was roughly unchanged for the quarter, the data from the Survey of Consumers indicate an expected gain of 2.9% in real personal consumption expenditures during 2018.

Rising interest rates out of the Federal Reserve are taking a toll on the housing sector, along with a shortage of supply in the market. However, overall, Americans do not see rate hikes as having the power to stop the expansion.

“Economic news heard by consumers continued to be dominated by the tax reform legislation and net job gains, which was untarnished by the consensus view that interest rates would increase and stock prices would remain volatile. Although rising interest rates was seen as a reason to temper their longer term outlook for the overall economy, only a modest moderation in the pace of economic growth was anticipated.”

Consumers also expected the unemployment rate to dip below 4% in 2018, with modest wage growth anticipated. Inflation expectations have remained unchanged.

“Interest rates, even when pushed higher in the weeks and months ahead, will not cause postponement of discretionary purchases as long as income continues to rise near its present pace,” Mr. Curtain said. “Personal tax cuts are crucial to spur additional spending, but unlike prior cuts that had an immediate positive impact, this tax cut has not generated universal support across partisan lines.”

Final Results for February 2018

Feb Jan Feb M-M Y-Y
2018 2018 2017 Change Change
Index of Consumer Sentiment 99.7 95.7 96.3 +4.2% +3.5%
Current Economic Conditions 114.9 110.5 111.5 +4.0% +3.0%
Index of Consumer Expectations 90.0 86.3 86.5 +4.3% +4.0%

Next data release: Friday, March 16, 2018 for Preliminary March data at 10am ET

The Survey of Consumers, a closely-watched gauge

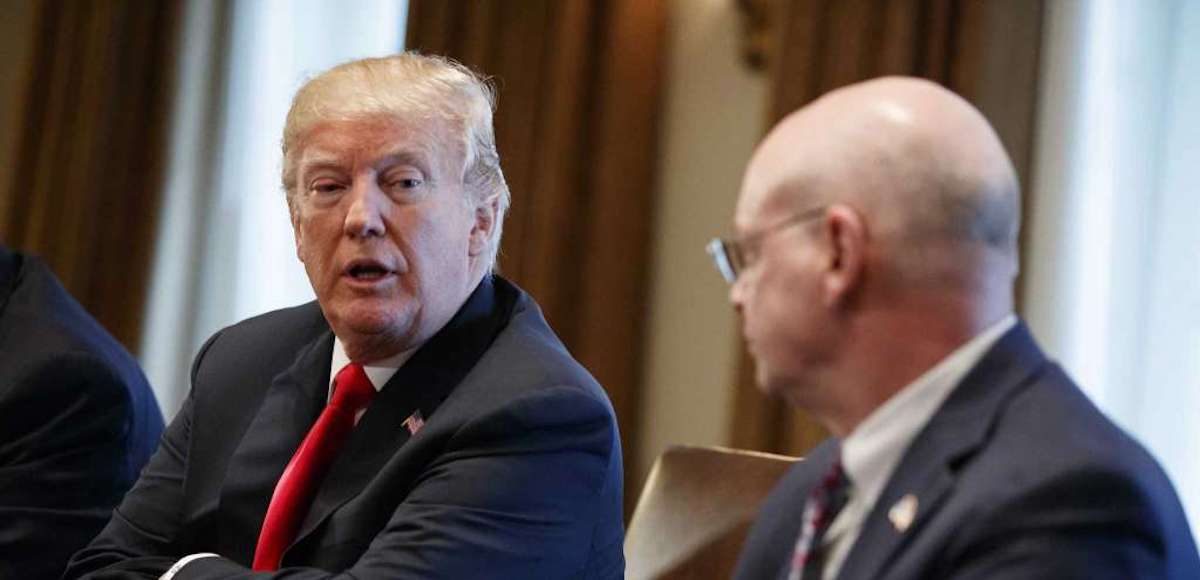
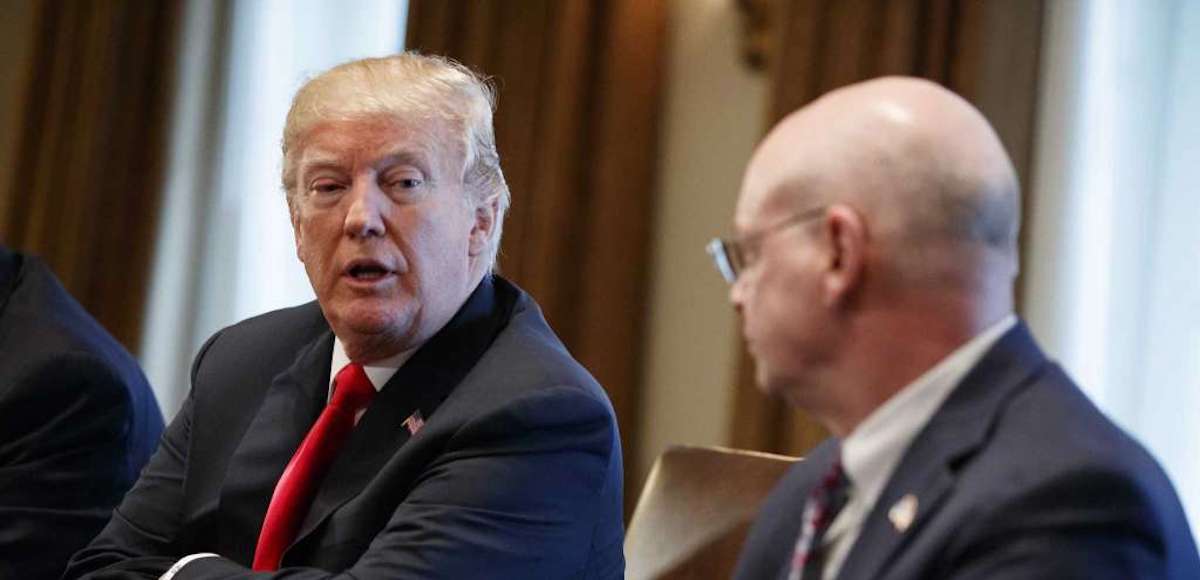
President Donald Trump speaks to Dave Burritt of U.S. Steel Corporation during a meeting with steel and aluminum executives in the Cabinet Room of the White House, Thursday, March 1, 2018, in Washington. (Photo: AP)

President Donald Trump speaks to Dave Burritt of U.S. Steel Corporation during a meeting with steel and aluminum executives in the Cabinet Room of the White House, Thursday, March 1, 2018, in Washington. (Photo: AP)

President Donald Trump on Thursday at the White House announced his administration will impose new tariffs on imported steel to protect U.S. producers. The move fulfills a major campaign promise and is widely supported by workers in Rust Belt states he carried in 2016, but critics say he risks retaliation from trading partners like China and Europe.

The move, which will be formally announced next week, will impose a 25% tariff on imported steel and 10% tariff on imported aluminum. It helped trigger a large selloff on Wall Street, which has been volatile over the last few weeks after sustained and historic gains following his election.

But U.S. Steel Corporation (NYSE: X) CEO David Burritt said during the meeting that the new tariffs on steel and aluminum imports are “vital to the interests of the United States.”

“This is vital to the interests of the United States. This is our moment, and it’s really important that we get this right,” Mr. Burritt said. “We believe that the leadership that this administration has shown on tax reform is simply outstanding. The elimination of bureaucracy is simply outstanding. We trust your judgment on this issue.”

Nucor Corporation (NYSE: NUE) President and CEO John Ferriola mirrored those sentiments and praised the Trump Administration for taking further action to protect U.S. industry. Nucor is now the largest steel producer in America.

“We believe very strongly that it’s time for decisive and meaningful action to stem the flow of illegally traded imports into this country,” added Mr. Ferriola. “And we are counting on the administration to fulfill the promises that were made and to give us that level playing field to compete.”

U.S. Steel Corporation CEO David Burritt said

Chairman, CEO and President of Nucor John Ferriola and U.S. Steel CEO Dave Burritt flank U.S. President Donald Trump as he announces his administration will levy new tariffs to product U.S. steel and aluminum manufacturing companies. (Photo: Reuters)

Chairman, CEO and President of Nucor John Ferriola and U.S. Steel CEO Dave Burritt flank U.S. President Donald Trump as he announces his administration will levy new tariffs to product U.S. steel and aluminum manufacturing companies. (Photo: Reuters)

President Donald Trump said on Thursday at the White House that his administration will impose new tariffs on imported steel and aluminum to protect U.S. producers. The measure fulfills a major promise made on the campaign trail and is widely supported by industry workers in Rust Belt states no Republican had carried before President Trump since the 1980s.

“We have with us the biggest steel companies in the United States. They used to be a lot bigger, but they’re going to be a lot bigger again,” President Trump said. “And we have the big aluminum companies in the United States. And they’ve been very unfairly treated by bad policy, by bad trade deals, by other countries.”

The president’s remarks came as he met with chief executive officers from major U.S. producers, including Nucor President and CEO John Ferriola and U.S. Steel CEO Dave Burritt. The industry has had high hopes the Trump Administration would reverse trade policies damaging to U.S. industry.

“They’ve been horribly treated by other countries, and they have not been properly represented. More importantly, because of that, workers in our country have not been properly represented,” the president said. “So we’re going to build our steel industry back and we’re going to build our aluminum industry back.”

The move, which will be formally announced next week, will impose a 25% tariff on imported steel and 10% tariff on imported aluminum. Wall Street reacted poorly to the measure, though most analysts believe the fundamentals of the U.S. economy are strong.

“We believe very strongly that it’s time for decisive and meaningful action to stem the flow of illegally traded imports into this country,” said Mr. Ferriola, who heads the largest steel production company in the U.S. “And we are counting on the administration to fulfill the promises that were made and to give us that level playing field to compete.”

President Donald Trump said on Thursday at

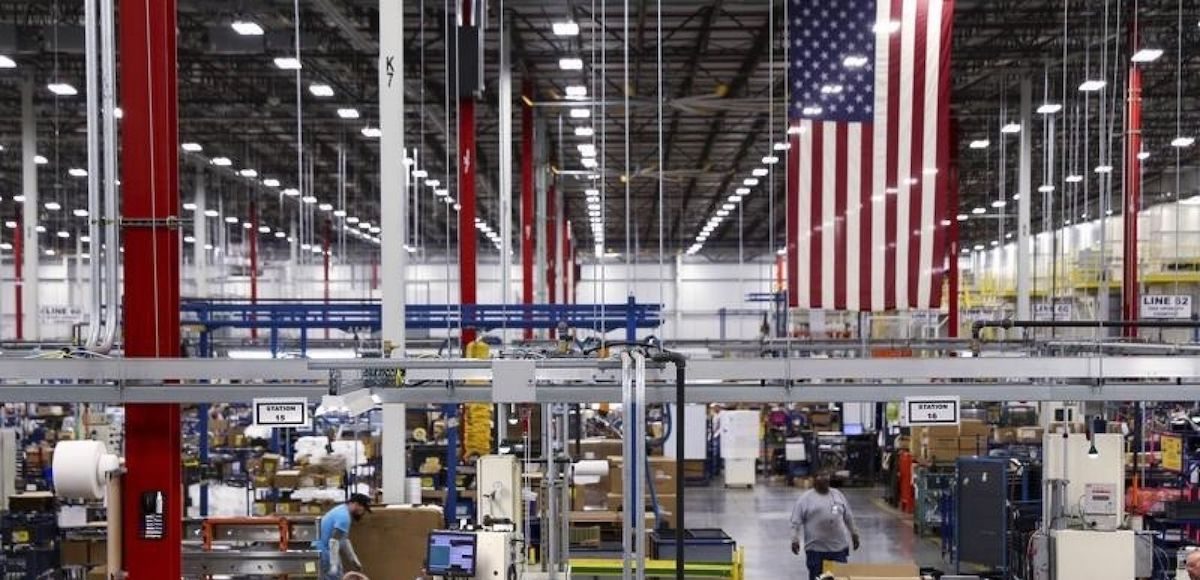
Workers assemble built-in appliances at the Whirlpool manufacturing plant in Cleveland, Tennessee August 21, 2013. (Photo: Reuters)

Workers assemble built-in appliances at the Whirlpool manufacturing plant in Cleveland, Tennessee August 21, 2013. (Photo: Reuters)

The Institute for Supply Management (ISM) manufacturing index (PMI) came in at a much higher than expected 60.8 in February, beating the 58.6 consensus forecast. This is the fastest pace of expansion and strongest reading in 14 years, or since 2004.

The overall strength of the PMI is shown in new orders, at 64.2, which are filling backlogs that are now at a 14-year reading of 59.8. In response, firms in the manufacturing index are reporting a need to hire new employees to fill demand and the Employment Index rose 5.5% to 59.7.

Orders for exports are notable in the sample, up 3 points in the month to 62.8, a 7-year high. Orders for imports are also very elevated at an 11-year high reading of 60.5.

Capacity stress is evident with delays at 61.1 for an 8-year high. Prices are another sign of stress with input costs at 74.2, up 1.5 points and the most severe reading in seven years.

Of the 18 manufacturing industries, 15 reported growth in February, in the following order:

  • Printing & Related Support Activities;
  • Primary Metals;
  • Machinery;
  • Computer & Electronic Products;
  • Petroleum & Coal Products;
  • Nonmetallic Mineral Products;
  • Plastics & Rubber Products;
  • Fabricated Metal Products;
  • Chemical Products;
  • Transportation Equipment;
  • Textile Mills;
  • Miscellaneous Manufacturing;
  • Paper Products;
  • Electrical Equipment, Appliances & Components; and
  • Food, Beverage & Tobacco Products.

Only two industries reported contraction during the period:

  • Apparel, Leather & Allied Products; and
  • Furniture & Related Products.

Respondents’ Comments

“Availability of electronic components, long lead times, allocations and constraints continue to wreak havoc in the purchasing cycle, with no end in sight at this time.” (Computer & Electronic Products)
“Our business saw [an] increase in fourth quarter, and it continued in January 2018. CapEx purchase deliveries are moving out globally.” (Chemical Products)
“Labor market continues to be tight for supply chain talent in the Southern California area. Overall economy is strong.” (Transportation Equipment)
“Employment is one of our biggest challenges. No labor available.” (Food, Beverage & Tobacco Products)
“Steel market is doing rather well. Everybody is out of what I need.” (Fabricated Metal Products)
“It seems the tax break for business is making a difference. Customers are spending more for capital equipment.” (Machinery)
“Hiring has picked up for direct-hire employees. Due to end-of-2017 performance and improvement in commodity price, there has been an increase in capital budget.” (Petroleum & Coal Products)
“Business is very strong, and our lines are running at full capacity.” (Plastics & Rubber Products)
“We expect to have a strong year in 2018. In expectation, we have added to our sales staff and plan on adding to our production staff.” (Miscellaneous Manufacturing)
“The weakening U.S. dollar in relationship to the yuan is starting to impact importing cost. We are starting to see more supplier price increases.” (Electrical Equipment, Appliances & Components)

The Institute for Supply Management (ISM) manufacturing index

New residential homes are shown under construction in Carlsbad, California September 19, 2011. (Photo: Reuters)

New residential homes are shown under construction in Carlsbad, California September 19, 2011. (Photo: Reuters)

The U.S. Census Bureau said total construction spending was flat in January (±1.0%) from the revised December estimate of $1,262.7 billion. The January figure is 3.2% (±1.3%) above the January 2017 estimate of $1,223.5 billion.

Private Construction

Spending on private construction was at a seasonally adjusted annual rate of $962.7 billion, 0.5% (± 0.7%) below the revised December estimate of $967.9 billion.

Residential construction was at a seasonally adjusted annual rate of $523.2 billion in January, 0.3% (±1.3%) above the revised December estimate of $521.8 billion. Nonresidential construction was at a seasonally adjusted annual rate of $439.6 billion in January, 1.5% (± 0.7%) below the revised December estimate of $446.2 billion.

Public Construction

In January, the estimated seasonally adjusted annual rate of public construction spending was $300.1 billion, 1.8% (±1.8%) above the revised December estimate of $294.8 billion. Educational construction was at a seasonally adjusted annual rate of $76.7 billion, 2.1% (±3.8%) above the revised December estimate of $75.2 billion. Highway construction was at a seasonally adjusted annual rate of $92.6 billion, 4.4% (±4.6%) above the revised December estimate of $88.8 billion.

The U.S. Census Bureau said total construction

People count money at Macy's Herald Square store during the early opening of the Black Friday sales in the Manhattan borough of New York, November 26, 2015. (Photo: Reuters)

People count money at Macy’s Herald Square store during the early opening of the Black Friday sales in the Manhattan borough of New York, November 26, 2015. (Photo: Reuters)

The Bureau of Economic Analysis (BEA) said personal income gained 0.4%, or $64.7 billion in January and personal consumption expenditures (PCE) gained $31.2 billion (0.2%). While wage gains beat the 0.3% median forecast, slightly softer spending matched the mark.

Disposable personal income (DPI) increased $134.8 billion (0.9%).

“Increases in the January estimates of disposable personal income and the personal saving rate mostly result from a decrease in personal current taxes, which reflect the effects of the Tax Cuts and Jobs Act (TCJA),” the government agency said. “BEA estimates that the TCJA reduced personal current taxes by $115.5 billion at an annual rate.”

Estimates for wages and salaries in January were adjusted up by $30.0 billion to account for bonuses paid by businesses that are not included in the monthly source data in the Current Employment Statistics from the Bureau of Labor Statistics. This revision reflects one-time bonuses reported by PPD and other outlets after the passage of the TCJA.

Real DPI gained 0.6% in January, Real PCE fell 0.1% and the PCE price index rose 0.4%.

Excluding food and energy, the PCE price index increased 0.3%. Personal outlays increased $33.7 billion in January. Personal saving was $464.4 billion in January and the personal saving rate, personal saving as a percentage of disposable personal income, was 3.2%.

The Bureau of Economic Analysis (BEA) said

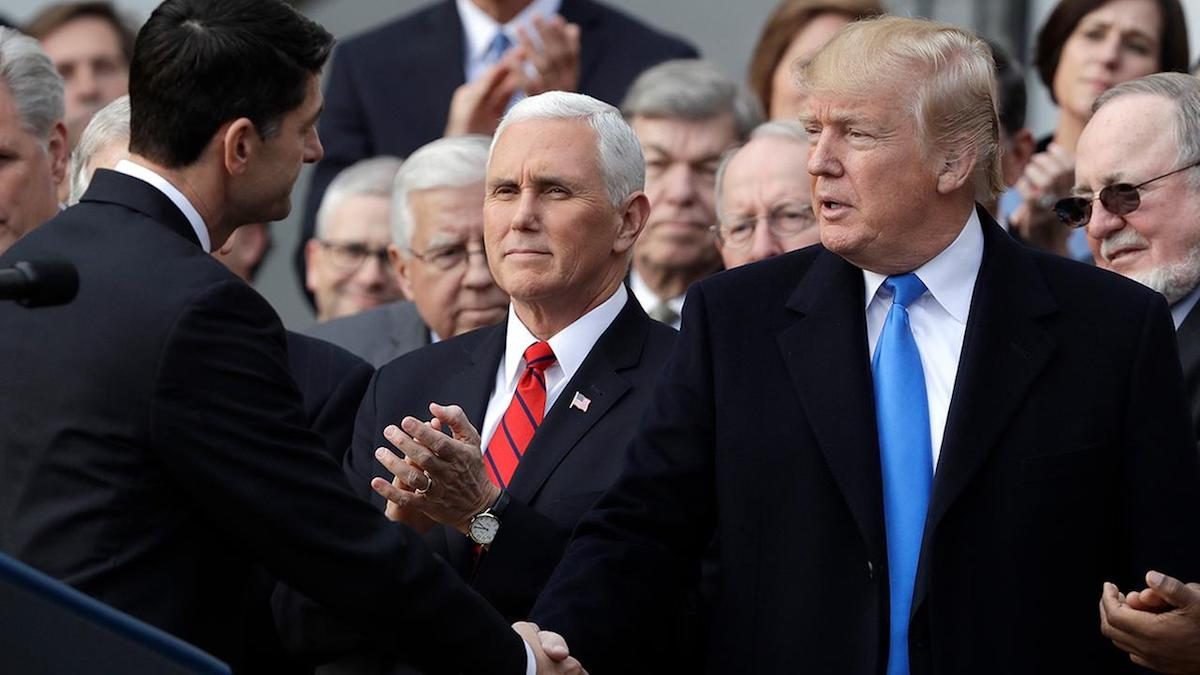
President Donald Trump shakes hands with House Speaker Paul Ryan of Wis., as Vice President Mike Pence and Congressional Republicans look on during a celebratory bill passage event following the final passage of the Tax Cuts and Jobs Act by Congress. (Photo: AP)

President Donald Trump shakes hands with House Speaker Paul Ryan of Wis., as Vice President Mike Pence and Congressional Republicans look on during a celebratory bill passage event following the final passage of the Tax Cuts and Jobs Act by Congress. (Photo: AP)

The Labor Department said weekly jobless claims fell 10,000 to a seasonally adjusted 210,000, the lowest level for initial unemployment benefits in more than 48 years.

That’s the lowest claims have been since December 6, 1969, when they were 202,000. The previous week’s level was revised down by 2,000 from 222,000 to 220,000.

The 4-week moving average declined 5,000 from the previous week’s revised average 220,500. This is the lowest level for this average since December 27, 1969 when it was 219,750. The previous week’s average was revised down by 500 from 226,000 to 225,500.

The advance seasonally adjusted insured unemployment rate was 1.4% for the week ending February 17, a slight gain of 0.1% from the previous week’s unrevised rate. The advance number for seasonally adjusted insured unemployment increased 57,000 for the week ending February 17 to 1,931,000. The previous week’s level was revised down by 1,000 from 1,875,000 to 1,874,000.

The 4-week moving average decreased 6,250 from the revised previous week to 1,920,000. The previous week’s average was revised down by 250 from 1,926,500 to 1,926,250.

Claims taking procedures in Puerto Rico and in the Virgin Islands have still not returned to normal from the hurricanes. Extended benefits were available in Alaska and the Virgin Islands during the week ending February 10.

The highest insured unemployment rates in the week ending February 10 were in the Virgin Islands (9.6), Alaska (3.8), Puerto Rico (3.4), New Jersey (3.0), Connecticut (2.9), Montana (2.8), Rhode Island (2.7), Massachusetts (2.6), Illinois (2.5), and Pennsylvania (2.5).

The largest increases in initial claims for the week ending February 17 were in Puerto Rico (+496), New Jersey (+333), Rhode Island (+95), Arkansas (+87), and Alabama (+59), while the largest decreases were in Michigan (-4,820), Illinois (-2,031), New York (-998), California (-924), and Washington (-913).

The Labor Department said weekly jobless claims

People's Pundit Daily
You have %%pigeonMeterAvailable%% free %%pigeonCopyPage%% remaining this month. Get unlimited access and support reader-funded, independent data journalism.

Start a 14-day free trial now. Pay later!

Start Trial