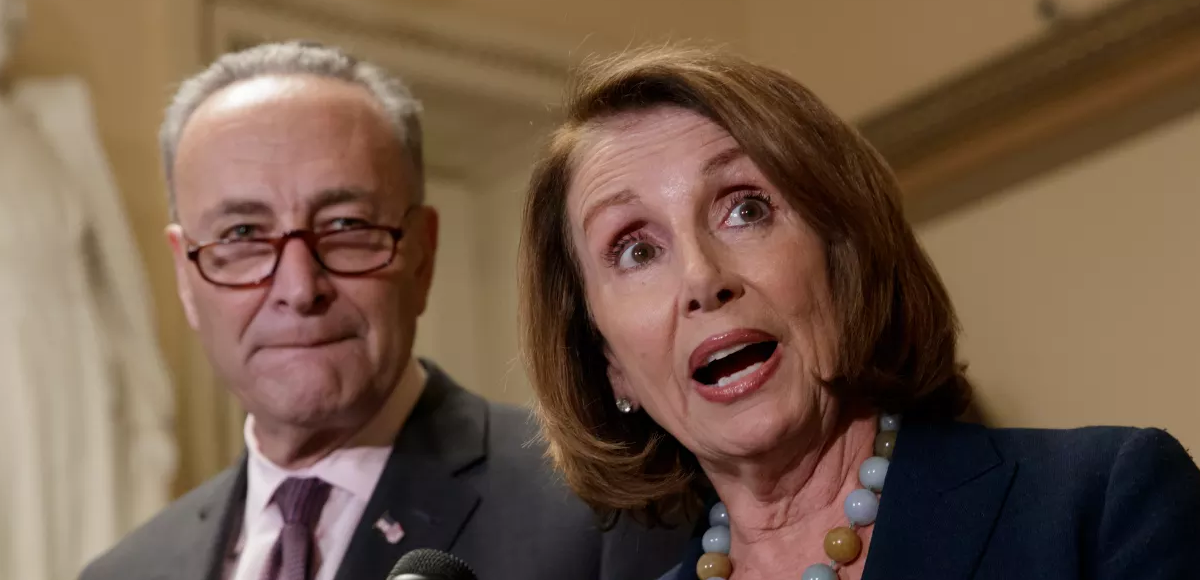
In this March 13, 2017, file photo, House Minority Leader Nancy Pelosi of Calif., accompanied by Senate Minority Leader Charles Schumer of N.Y., speaks to reporters on Capitol Hill in Washington. (Photo: AP)
We are done with this charade. The disturbing truth is very simple: The Democratic Party believes importing new voters and changing the face of America is more important than protecting the lives of Americans, which is the one true role for government.
For Democrats, whether or not a “diversity-driven” immigration system imports national security risks along with new voters is a concern that comes in a very distant second. For Democrats, the victims of Islamic terrorism and MS-13 gang violence are now and have for years been considered acceptable losses.
We will no longer be constrained by the false construct that uses political correctness to determine what is or isn’t acceptable to say. The truth is acceptable no matter how rude, brash or horrid it sounds.
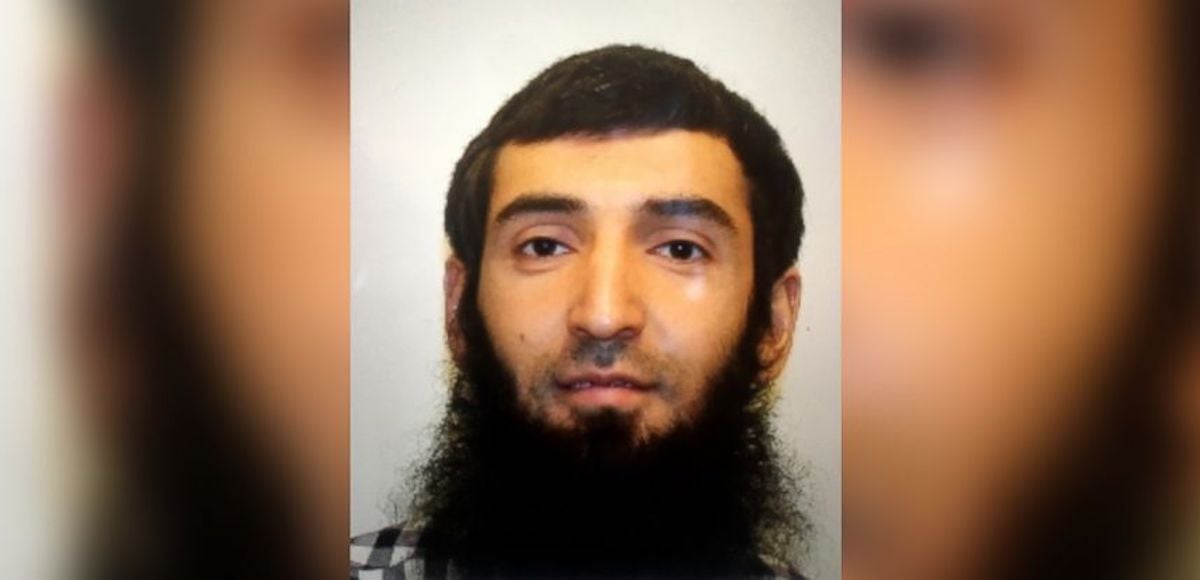
As People’s Pundit Daily (PPD) was first to report, the 29-year-old Uzbekistan national who killed 8 and injured at least 11 others during a terror attack near the World Trade Center on Tuesday, came to the U.S. under the Diversity Immigrant Visa (DV) Program in 2010. Sayfullo Saipov won a lottery in a program Chuck Schumer, D-N.Y., successfully pushed in the 1990s expanding the Immigration and Nationality Act (INA).
He won. His victims lost.
He repaid this country by renting pickup truck from Home Depot and driving it through a crowded bike path for several blocks before finally crashing into a yellow school bus. He then exited that truck shouting “Allahu Akbar” and waiving around what authorities believed to be an airsoft or B.B. gun.
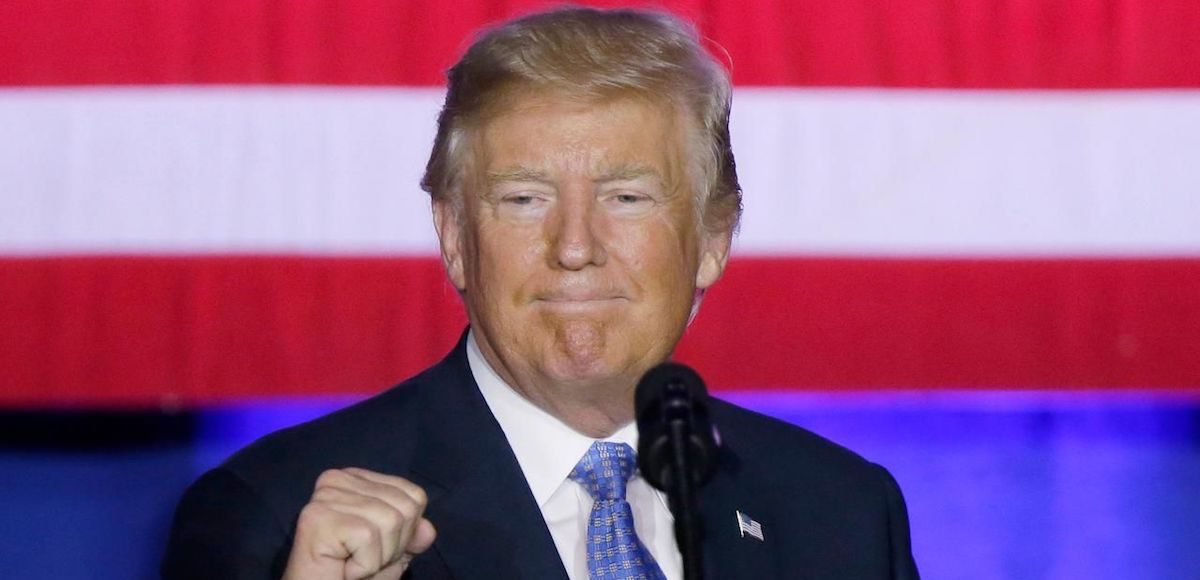
President Donald Trump on Twitter called it “a Chuck Schumer beauty” and, as crude and blunt as his style is, he’s absolutely right. The INA turned longstanding U.S. immigration policy on its head. Democrats pushed several more pieces of legislation after and in response to Ronald Reagan’s landslide over Jimmy Carter in 1980.
For Democrats, the election revealed Americans, specifically traditional Americans, simply could not be trusted not to reject big government. They had to be replaced and immigration was the way they were going to do it.
In 1986, Ted Kennedy duped President Reagan and engineered a blanket amnesty that eventually added millions of new voters to the Democratic Party. Senator Schumer pushed the 1990 Immigration Act and further increased overall immigration by another 35%.
It’s not as if these dangers weren’t known.
“The 1990 act also established the lottery whereby we randomly give away 50,000 green cards a year to people in countries picked because they have the least ties and cultural association with the United States, and which disproportionately are terrorist-sponsoring countries,” Roy Beck of the nonpartisan NumberUSA warned nearly a decade ago.
Yet, Democrats then-and-now call him and other advocates of a merit-based immigration system racists and bigots.
When President Trump signed an executive order suspending the refugee program and limiting the entry to the U.S. for travelers from 6 Muslim-majority nations known to be hotbeds of Islamic terrorism, Senator Schumer used skills his Hollywood buddies taught him to whip up tears. Fake crying at the microphone, he called the order “mean spirited” and unAmerican.
He forgot to mention that nearly 30% of the roughly 1,000 domestic terror cases involve refugees, according to the Department of Homeland Security (DHS) and the Federal Bureau of Investigation (FBI). Our nation’s law enforcement agencies are completely overwhelmed and no amount of funding will change that.
Instead, Democrats went judge-shopping for the most liberal, the most overturned disgraces in the land.
Despite the constitution and overwhelming public support for the order, these hack activists posing as judges granted one stay after another. Thankfully, the U.S. Supreme Court followed the Constitution and reversed those illegal decisions.
But if Democrats had their way — if Hillary Clinton and Democrats had won the election in November — those hacks in a robe would run the highest court in the land, too.
An unspoken but significant reason why Democrats were so shocked at their defeat in 2016 is because they believed that the point of no return had been reached. They believed their precipitous slide among white voters would easily be offset by new voters resulting from their decades-long silent invasion.
But they were wrong.
President Trump won the largest two-party share of the white working class vote of any Republican candidate, topping President Reagan’s record set in 1984. It enabled him to carry diverse battleground states like Florida and traditionally Democratic working class states like Michigan, Pennsylvania and Wisconsin. He crushed Mrs. Clinton in traditional battlegrounds like Ohio and Iowa, where white voters are the vast majority of the electorate.
Democrats have made no attempt to understand the concerns of those Americans, and have moved forward with their plan to change America. They’ve double-down on claiming bigotry is rampant, while ignoring the obvious hatred they have for Middle America.
Nothing is going to change.
At least as far as we know, we all have only one life to live. It’s time we force Democrats to admit why they believe we should put those lives at risk. The truth is simple, it’s ugly and it can be summed up in one word.
Votes.
Enough is enough. The victims of Islamic