Widget Image
Follow PPD Social Media
Tuesday, January 7, 2025
HomeStandard Blog Whole Post (Page 29)

Graphic concept for the Department of Justice (DOJ) and the Federal Bureau of Investigations (FBI). (Photo: AdobeStock)

Asbury Park, N.J. (PPD) — Nearly half of likely voters believe senior federal law enforcement officials broke the law to prevent Donald Trump from winning the presidency. Moreover, a majority of Republicans would like to see James Comey prosecuted for it.

A Rasmussen Reports national phone and online survey finds 63% of Republicans believe the law was broken in a conspiracy against the president, to include 48% who say it’s very likely. The same is true of 39% of Democrats and 42% of voters not affiliated with either major party.

Overall, 48% of all voters believe senior federal law enforcement officials at FBI and the Justice Department broke the law. That compares to just 32% when the survey first asked the question two years ago, and down only slightly from 51% and 50% in June 2018 and February 2018, respectively.

The poll results come as newly unsealed documents and text messages provided the clearest and most damning evidence the Federal Bureau of Investigation setup former National Security Advisor Lt. General Michael Flynn.

Overall, voters are evenly split on whether the former fired FBI director should be criminally prosecuted. Nearly 4 in 10 (39%) voters say he should, though 40% disagree. However, significantly, one-fifth (20%) are undecided.

By party, 54% of Republicans believe Mr. Comey should be prosecuted juxtaposed to 31% of Democrats and 32% of voters not affiliated with either major party.

The survey of 1,000 Likely Voters was conducted May 4 – May 6, 2020 by Rasmussen Reports. The margin of sampling error is +/- 3 percentage points with a 95% level of confidence.

Nearly half of likely voters say senior

Watch Live 10:00 AM EST (PPD) — On ‘Inside The Numbers’ Episode 24, we discuss trends in educated voters, derelict lawmakers, and markets shrugging off jobless claims.

Subscribe to PPD on YouTube!

From Monday, May 4 to Sunday May 10, PPD and Inside The Numbers are the sponsor of the Rasmussen Reports Daily Presidential Tracking Poll.

Discussed on This Episode

Watch Live 10:00 AM EST (PPD) —

Jobless Claims Worse than Forecast, But Continue Trending Down

Washington, D.C. (PPD) — The U.S. Labor Department (DOL) reported initial jobless claims rose slightly more than expected by 3,169,000 for the week ending May 2, due to the mitigation efforts to slow the spread of the coronavirus (COVID-19). That’s a decrease of 677,000 from the previous week’s upwardly revised (7,000) level of 3,846,000.

Forecasts ranged from a low of 2,000,000 to a high of 3,420,000. The consensus forecast was 3,041,000. Roughly 30 million Americans are now out of work as a result of the efforts to slow the spread of the coronavirus (COVID-19).

The 4-week moving average came in at 4,173,500, a decline of 861,500 from the previous week’s revised average. The previous week’s average was revised up by 1,750 from 5,033,250 to 5,035,000.

Lagging Jobless Claims Data

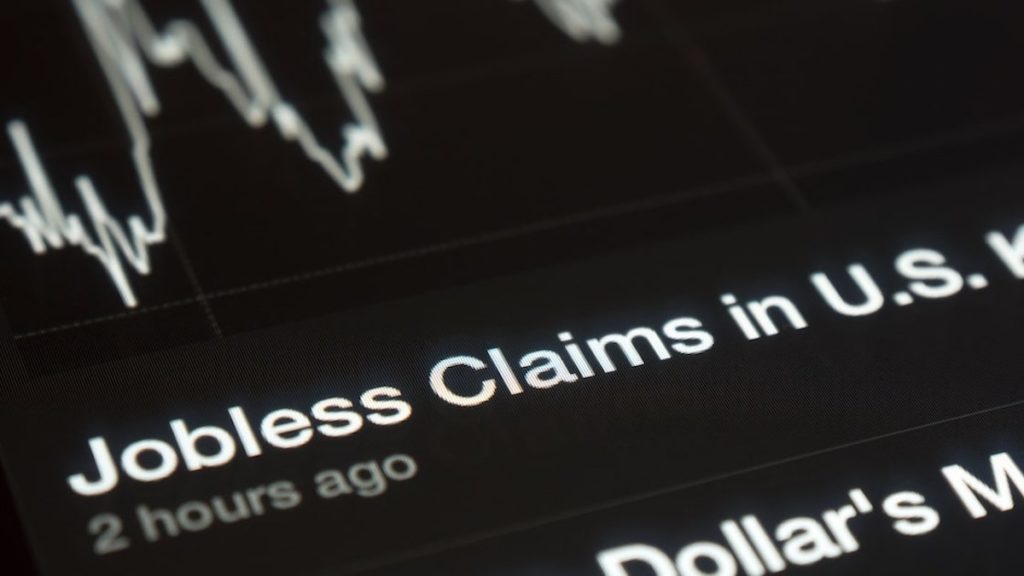
U.S. initial jobless claims graph on a tablet screen. (Photo: AdobeStock)

The advance seasonally adjusted insured unemployment rate rose again to 15.5% for the week ending April 25, an increase of 3.1%. This marks the highest level of the seasonally adjusted insured unemployment rate in the history of the series.

The first high during the current crisis was recorded at 8.2% for the week ending April 4. The all-time high prior to that was 7.0%, recorded in May of 1975. On April 11, it rose to 11.0% and 12.4% on April 25.

Under the Trump Administration, this rate had fallen to an all-time low 1.1% and remained at 1.2% just weeks ago, before coronavirus (COVID-19) mitigation efforts.

The advance number for seasonally adjusted insured unemployment during the week ending April 25 was 22,647,000, an increase of 4,636,000 from the previous week’s revised level. The previous week’s level was revised up 19,000 from 17,992,000 to 18,011,000.

The 4-week moving average was 17,097,750, an increase of 3,800,250 from the previous week’s revised average. The previous week’s average was revised up by 5,000 from 13,292,500 to 13,297,500

The highest insured unemployment rates in the week ending April 18 were in Vermont (25.2), West Virginia (21.9), Michigan (21.7), Rhode Island (20.4), Nevada (19.9), Connecticut (18.7), Puerto Rico (17.9), Georgia (17.3), New York (17.2), and Washington (17.1).

The largest increases in initial claims for the week ending April 25 were in Washington (+56,030), Georgia (+19,562), New York (+14,229), Oregon (+12,091), and Alabama (+8,534), while the largest decreases were in California (-203,017), Florida (-73,567), Connecticut (-69,767), New Jersey (-68,173), and Pennsylvania (-66,698).

Initial jobless claims rose slightly more than

ADP National Employment Report Through April 12 Does Not Reflect Full Impact of COVID-19 Mitigation Efforts

Roseland, N.J. (PPD) — The ADP National Employment Report private sector employment fell by 20,236,000 jobs, the largest drop ever recorded. Like the Employment Situation Report released each month by the Bureau of Labor Statistics (BLS), datafor the ADP report is collected for pay periods ending April 12 and does not reflect the full impact of COVID-19 mitigation efforts.

Forecasts ranged from a low of -22,500,000 to a high of -9,300,000. The consensus forecast was -20,000,000. UPDATE: The revised figure for April ended up beating the forecast at -19,557,000.

Job Loss theme with viruses and downward stock price charts. (Photo: AdobeStock)

“Job losses of this scale are unprecedented. The total number of job losses for the month of April alone was more than double the total jobs lost during the Great Recession,” said Ahu Yildirmaz, co-head of the ADP Research Institute. “Additionally, it is important to note that the report is based on the total number of payroll records for employees who were active on a company’s payroll through the 12th of the month.”

“This is the same time period the Bureau of Labor and Statistics uses for their survey.”

ADP National Employment Report Through April 12

Watch Live 10:00 AM EST (PPD) — On ‘Inside The Numbers’ Episode 23, we discuss new polling results, how models bring mayhem, and markets.

Subscribe to PPD on YouTube!

From Monday, May 4 to Sunday May 10, PPD and Inside The Numbers are the sponsor of the Rasmussen Reports Daily Presidential Tracking Poll.

Discussed on This Episode

Watch Live 10:00 AM EST (PPD) —

Illustration of the stock market with the bull for a price growth and the bear for a price fall. The background is blue with a typical chart. (Photo: AdobeStock)

New York, N.Y. (PPD) — Stocks gave back half their gains in the last 45 minutes of trading Tuesday, as investors continue to weigh the prospects for reopening the economy against the backdrop of record setting unemployment and rising bankruptcies.

From a technical perspective, all three major market averages backed off from key levels of resistance for the second time in two weeks following a strong six-week rally. Tuesday’s gains were led by Health Care +2.2% and Information Technology +1.4%.

The only sector finishing in the red was Financials -0.1%, while Consumer Staples (toilet paper) +0.1% also notably underperformed.

If early trading in stock index futures are any indication of market direction later this morning, we’re looking to make another assault at the same resistance levels that turned back the rally yesterday.

The Dow Jones Industrial Average (^DJI) held on to a gain of +0.6% to close at 23883.09 after having spent the first 6 hours of the day above the 24000 marker.

The S&P 500 (^SPX) closed just off its lows of the day at 2868.44, still a gain of +0.9% on the day. It’s worth noting that the S&P never touched the 2900 barrier intraday, despite being within 5 points of it for most of the afternoon.

The S&P has only closed north of the 2900 barrier twice since the first week of March. That was just last week, specifically the last two days of April. We need a rally of just over +1% for the S&P to close above 2900.

The NASDAQ Composite (^IXIC) continues its recent outperformance with a gain of +1.1% to close at 8809.12. The Nasdaq briefly crossed the 8900 level before the market drop during the last 45 minutes of trading. Keep a close watch on the 8900 – 9000 resistance level, as we’ll be there again this morning right after the 9:30 am opening.

The Russell 2000 (^RUT) closed at 1273.51, a gain of +0.75% after having flirted with the 1300 level earlier in the day. While the Russell did post a couple closing prints above 1300 last week, the real serious resistance level is a 100 point gap between 1350 and 1450 that spans the March 6 to March 10 closing prices. In the immediate term, that’s a heavy lift.

New York, N.Y. (PPD) — Stocks gave

Ratcliffe Called China “Greatest Threat” in First Hearing Since Pandemic

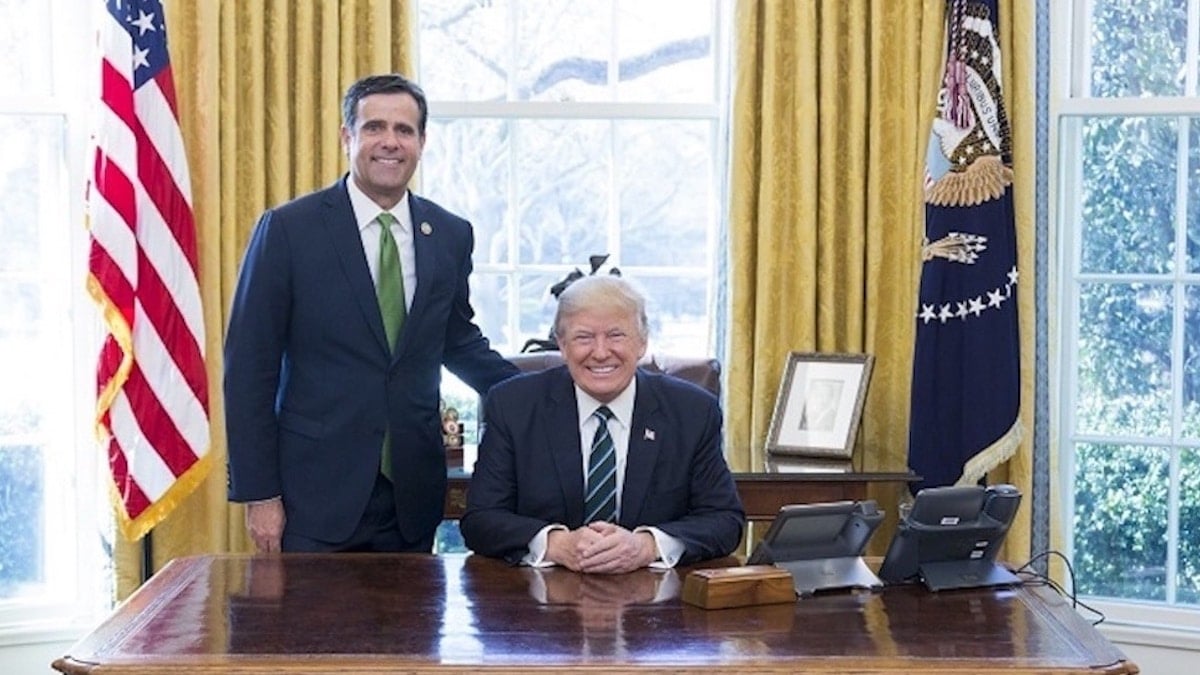
President Donald Trump meets with John Ratcliffe and the Republican Study Committee regarding healthcare in the Oval Office on Friday, March 17, 2017. (Official White House Photo by Shealah Craighead)

Washington, D.C. (PPD) — Rep. John Ratcliffe, R-Tx., the president’s nominee for Director of National Intelligence, faced the Senate Intelligence Committee in the first hearing since the pandemic. He pledged to deliver “unvarnished” intelligence to Donald Trump, and said China represents the “greatest threat” to the nation.

“The best job I ever had was to be the United States Attorney and what I loved … was it was an apolitical position,” he told the members of the committee during the confirmation hearing. “I stood up always to represent the United States of America. Never one party or another. And I very much view that as this role for the DNI.”

The Texas lawmaker has been a staunch supporter of the president and was a persuasive, effort opponent of impeachment during the proceedings. But he made clear on Tuesday that he looks forward to leaving politics behind.

“I look forward to treating every member, Republican and Democrat, exactly the same way,” he said. “And, frankly, being out of politics.”

Rep. Ratcliffe has had a long road to the confirmation hearing on Tuesday. In August, he withdrew his name from consideration after the scandal-embattled Senator Richard Burr, R-N.C., Chairman of the Senate Intelligence Committee, worked to sink his nomination before it got started.

Ranking Member Senator Mark Warner, D-Va., and the chairman attempted to force the president into appointing a more intelligence-friendly DNI amid investigations into wrongdoing by the intelligence community.

Chairman Burr has come under fire recent for alleged insider trading ahead of the stock market crash triggered by the coronavirus pandemic. On February 13, he and his wife sold off shares of companies worth $1.7 million over a large number of trades. Those shares were worth at least $250,000 less at the close of the trading day on March 19.

The selloffs came before the collapse of the markets due to the Coronavirus (COVID-19) and after he received a secret briefing about the pandemic. Publicly, Senator Burr remarked that the economy was sound, while privately he told others it could be a pandemic akin to the 1918 Spanish Flu.

The U.S. Justice Department (DOJ) announced in March that it would be investigating the allegations. Most assuredly, the development has bolstered Rep. Ratcliffe amid critics arguing he doesn’t possess the experience.

“I have to say that, while I am willing to give you the benefit of the doubt in this hearing, I don’t see what has changed since last summer when the president decided not to proceed with your nomination over concerns about your inexperience, partisanship, and past statements that seemed to embellish your record,” Sen. Mark Warner said.

The congressman has served as the Ranking Member of the House Subcommittee on Crime, Terrorism and Homeland Security. The White House was fully willing to wage the nomination battle, despite Senator Warner’s claim.

“As the president’s principal intelligence advisor, I would ensure that all intelligence is collected analyzed and reported without bias, prejudice or political influence,” he said.

Richard Grenell, the U.S. Ambassador to Germany, has been serving as acting DNI since Mr. Coats left the post last summer under a cloud of criticism. Mr. Coats, himself a former senator, was stonewalling efforts to uncover wrongdoing.

That stands in stark contrast to Mr. Grenell, who recently ordered the 17 intelligence agencies under the post to review whether they are complying with strict guidelines on unmasking U.S. citizens.

President Trump nominated Rep. Ratcliffe in late February. His nomination now must obtain approval of the Senate Intelligence Committee before heading to the full U.S. Senate for a vote.

Rep. John Ratcliffe, R-Tx., the president's nominee

NMI, Gauge of U.S. Service Sector Activity, Lowest Since March 2009

The Institute for Supply Management (ISM) Non-Manufacturing Index (NMI) fell sharply in April, though less than expected to 41.8. That’s a decline of 10.7 percentage points from 52.5 in March.

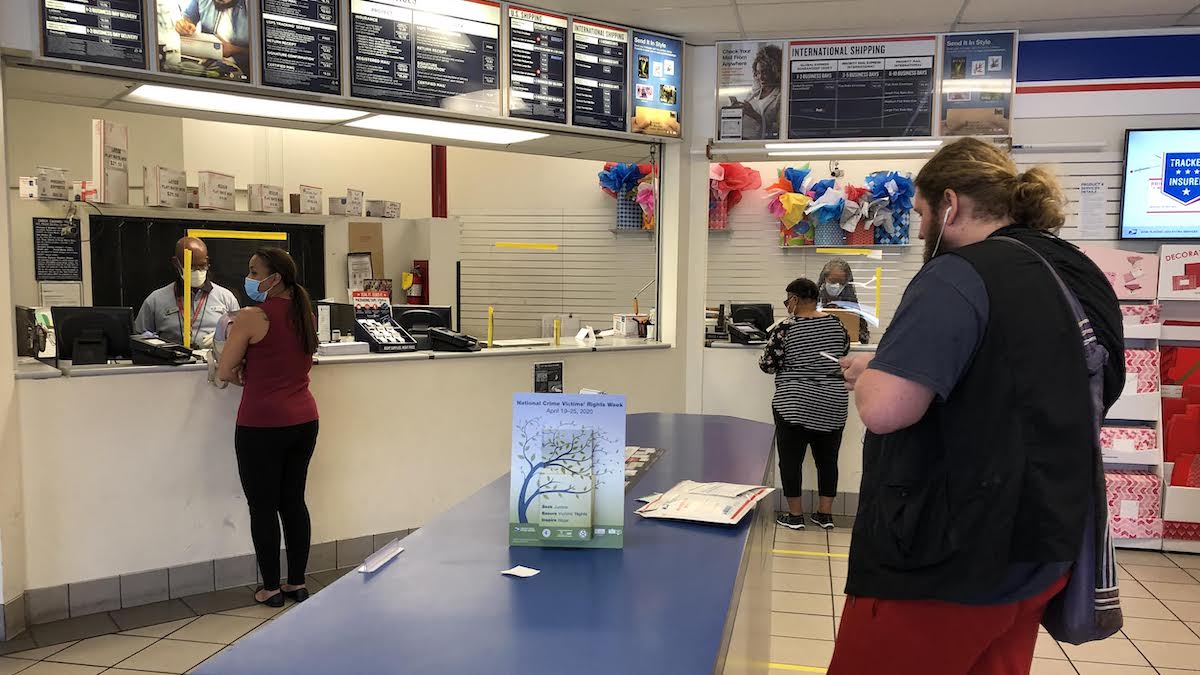
United States Postal Service (USPS) workers don face masks and gloves behind plexiglass at the USPS location on N. Main in Gainesville, Fla., during the coronavirus (COVID-19) pandemic. (Photo: People's Pundit Daily/PPD)
United States Postal Service (USPS) workers don face masks and gloves behind plexiglass at the USPS location on N. Main in Gainesville, Fla., during the coronavirus (COVID-19) pandemic. (Photo: People’s Pundit Daily/PPD)

Forecasts ranged from a low deficit of $45.2 billion to a high of $34.0 billion. The consensus forecast was $44 billion. Still, it’s the lowest reading for the NMI since March 2009, when it was 40.1%.

The Supplier Deliveries Index offset the overall decline in the NMI by registering at an all-time high of 78.3, a gain of 16.2 percentage points from the March reading of 62.1. Comments from the panel reveal an obvious and clear result of the mitigation efforts to “slow” the spread of the Coronavirus (COVID-19).

WHAT RESPONDENTS ARE SAYING
  • “General uncertainty over ramp-up timeline post COVID-19.” (Accommodation & Food Services)
  • “The COVID-19 situation has created significant challenges for the agricultural sectors. Milk prices have declined 29 percent in a few weeks. Milk is being dumped on farms because of the loss of markets. Cattle prices are down 28 percent, pork prices down 24 percent, [and] all agriculture sectors are facing significant price declines. Our agriculture economy is challenged, with poultry, pork, and beef processing plants closed due to COVID-19 cases or impaired due to employees afraid to work side-by-side with other employees. Farmers cannot sell fat cattle locally due to processing plant shutdowns.” (Agriculture, Forestry, Fishing & Hunting)
  • “COVID-19 pandemic has forced our business to close as of March 17, 2020. We do not have a re-opening date yet; our purchasing activity has been greatly reduced due to the current business environment.” (Arts, Entertainment & Recreation)
  • “COVID-19 is altering the operation, supply chain and sales process of home-building. Stay-at-home orders have hampered business in residential construction. As ours has been deemed an essential industry, we continue to navigate changing guidelines and restrictions on a daily basis.” (Construction)
  • “The university abruptly transitioned from students on campus to remote teaching for the spring quarter; however, the number of students registered for the quarter has remained consistent with previous years. Overall, activity dropped 17 percent compared to February and 31 percent compared to March 2019.” (Educational Services)
  • “Due to increased loans from [the federal] stimulus package, [we are] seeing an increase in new business.” (Finance & Insurance)
  • “COVID-19 has halted much of our standard work to procure items for our organization. It’s halted much of the world, except for health care. Distributors were woefully unprepared for the spread of this pandemic, and many health-care systems/providers depend on them for inventory planning and availability. Combine that with the global [surgical] gown recall just before the pandemic struck — and isolation masks are created from the same material as isolation gowns — and you had a perfect storm for chaos across the supply chain. It will be very hard for major medical distributors who did not manage their core customers well to recover from both the gown recall and the pandemic. It also provided some insight into whether or not the distributor partners were actually skilled at inventory planning and movement. I believe that the healthcare supply chain landscape will change dramatically after this.” (Health Care & Social Assistance)
  • “The oil exploration sector is very weak, with the record low price of oil and the country’s shutdown due to the COVID-19 threat. We are hopeful for a bump in activity once the country starts to reopen.” (Management of Companies & Support Services)
  • “New challenges working from home and getting inventory to the retail locations.” (Retail Trade)
  • “As an essential business, we have remained open during the month. A significant number of our customers are closed (i.e. schools) and other have substantially reduced their buying (i.e. hotels, office building). Sales of janitorial, sanitation, and paper products [have] increased across all business lines, but other categories are greatly reduced. Overall, reduction in sales of 20 percent to 30 percent.” (Wholesale Trade)

The Institute for Supply Management (ISM) Non-Manufacturing

Watch Live 10:00 AM EST (PPD) — On ‘Inside The Numbers’ Episode 22, we discuss new polling results and threats from coronavirus (COVID-19).

Subscribe to PPD on YouTube!

From Monday, May 4 to Sunday May 10, PPD and Inside The Numbers are the sponsor of the Rasmussen Reports Daily Presidential Tracking Poll.

Discussed on the Show

Rasmussen Reports Daily Presidential Tracking Poll

Most Think America Will Be Great Again

U.S. Trade Deficit Widens 11.6% in March, Meeting Forecast

Non-Manufacturing Index (NMI) Falls Less than Expected in April

PPD Markets

Watch Live 10:00 AM EST (PPD) —

Goods and Services Deficit Still Down 17.8% Year-to-Date

U.S. Economy. Import export business. Stacked cargo containers. Flag of the United States. 3D rendering. (Photo: AdobeStock)

Washington, D.C. (PPD) — The U.S. Census Bureau and the U.S. Bureau of Economic Analysis (BEA) reported the U.S. trade deficit for goods and services widened $4.6 billion (+11.6%) to $44.4 billion in March. That roughly met the forecast and follows a $39.8 billion trade deficit in February, revised.

Forecasts ranged from a low deficit of $45.2 billion to a high of $34.0 billion. The consensus forecast was $44 billion.

The increase in the goods and services deficit was driven by an increase in the goods deficit of $4.6 billion to $65.6 billion and a decrease in the services surplus of $0.1 billion to $21.2 billion. Exports were down $20 billion to $187.7 billion in March and imports were down $15.4 billion to $232.2 billion.

Year-to-date, the goods and services deficit has still narrowed by $28.1 billion, or 17.8% from the same period in 2019. Exports fell $21.7 billion or 3.5%, while imports were down $49.7 billion or 6.4%.

The three-month moving average for the goods and services deficit fell $1.4 billion to $43.2 billion ending in March. Average exports declined $7.2 billion to $201.3 billion and imports fell $8.6 billion to $244.5 billion.

The three month moving average goods and services deficit year-over-year narrowed $9.4 billion. Average exports narrowed $7.2 billion and average imports by $16.6 billion from March 2019.

Trade in Goods By Country for March

The politically-sensitive trade in goods deficit with China fell $4.2 billion to $15.5 billion. Exports rose $0.3 billion to $7.8 billion and imports fell $3.9 billion to $23.3 billion.

The trade in goods surplus with the United Kingdom (UK) fell $1.2 billion to $0.1 billion. Exports were down $1.3 billion to $4.9 billion, but imports were down less than $0.1 billion to $4.8 billion.

The trade in goods deficit with the European Union rose $4.3 billion to $16.9 billion. Exports fell $0.6 billion to $21.8 billion and imports rose $3.7 billion to $38.7 billion.

The U.S. trade deficit for goods and

People's Pundit Daily
You have %%pigeonMeterAvailable%% free %%pigeonCopyPage%% remaining this month. Get unlimited access and support reader-funded, independent data journalism.

Start a 14-day free trial now. Pay later!

Start Trial