Widget Image
Follow PPD Social Media
Wednesday, January 8, 2025
HomeStandard Blog Whole Post (Page 31)

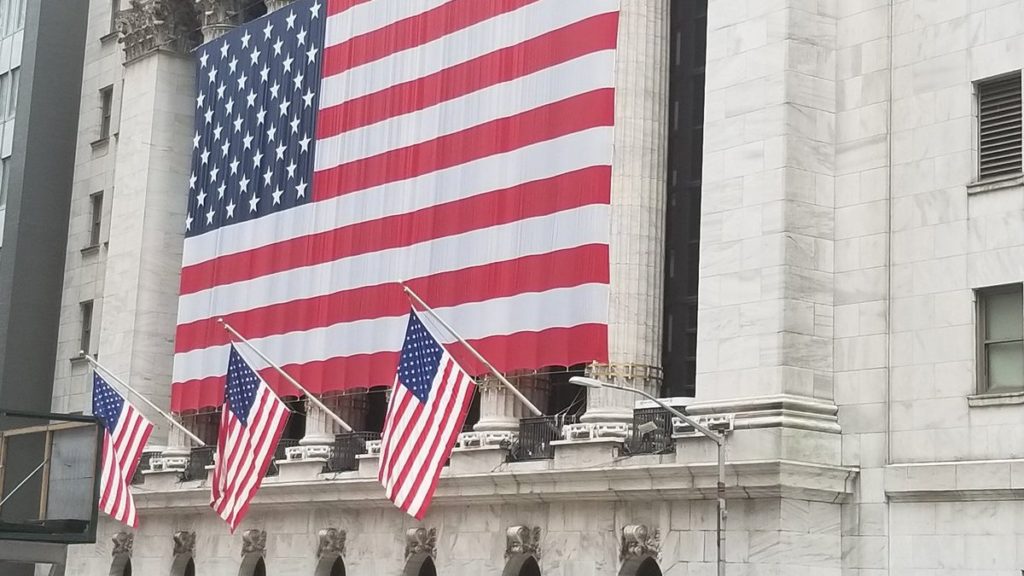
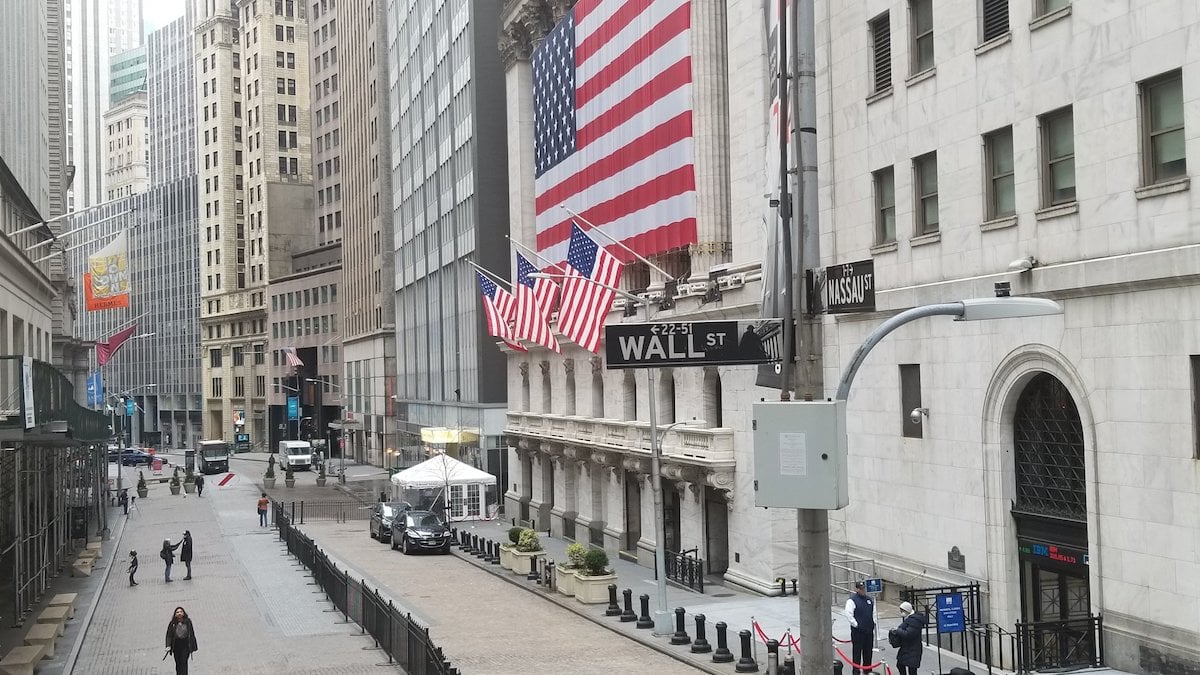
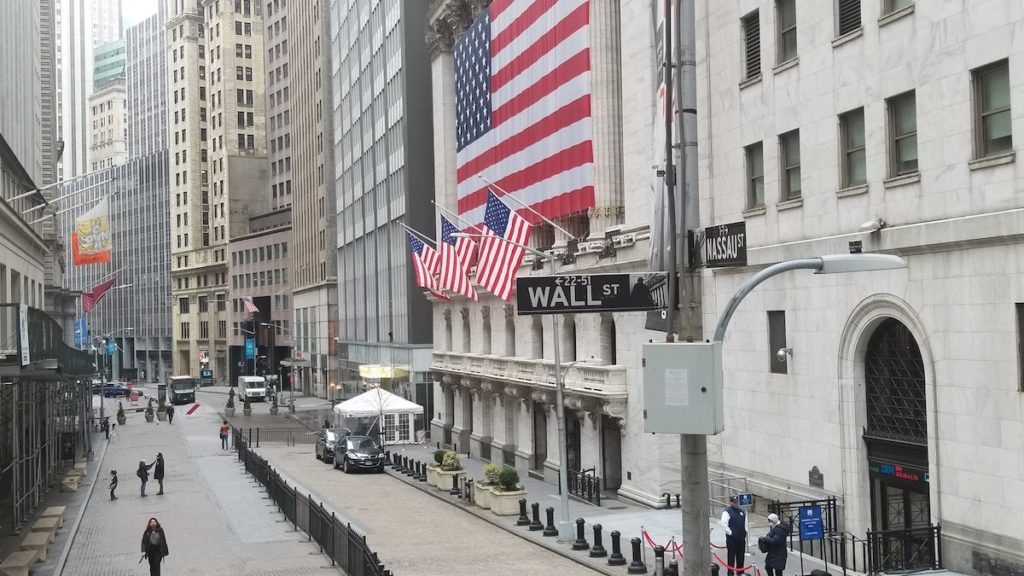
The New York Stock Exchange (NYSE) from the corner of Wall Street Nassau Street during the Conoravirus (COVID-19) outbreak on March 26, 2020. (Photo: People's Pundit Daily)
The New York Stock Exchange (NYSE) from the corner of Wall Street Nassau Street during the Conoravirus (COVID-19) outbreak on March 26, 2020. (Photo: People’s Pundit Daily)

New York, N.Y. (PPD) — April has been a sigh of relief, followed by redemption for investors who waited out the brutal mauling markets took in March. We’ll see headlines all day of “The best month since early 1987”, regardless the stark differences.

Perspective, of course is routinely lost in the headlines. For right now, we’ll take it.

Stocks posted impressive across-the-board gains Wednesday as investors cheered plans to kickstart the economy, positive test results on the drug Remdesivir and some stabilization in oil markets.

At the risk of redundancy, we again highlight that markets are shrugging off horrific economic data, as Q1 GDP reported the largest drop in nearly 12 years at -4.8%. Pro Tip: While Q2 GDP will be MUCH worse, by the time it’s reported in late July, we’ll be well on our way to a robust recovery.

The Dow Jones Industrial Average (^DJI) gained +532.31 points or +2.2% to close at 24633.86. The Dow has rallied +7% in the last 6 trading days and has gained +32.3% from the March 23 lows. The Dow Jones remains -20% from its highs 10 weeks ago.

The S&P 500 (^SPX) rallied +76.12 points or +2.7% to settle at 2939.51. This brings the S&P less than 70 points from its 200 day moving average of 3006, and of course the 3000 milestone. In five weeks since the March 23 lows, the S&P 500 has rallied +31.4% to get within 65 points of the 3000 benchmark.

The S&P was led by Energy +7.3%, bringing its 2 day gain to nearly +10%; Communication Services +5% and Information Technology +4.2%. Laggards were Utilities -0.9%; Consumer Staples (ie: toilet paper) -0.4% and Health Care +0.7%.

The NASDAQ Composite (^IXIC) shrugged off Tuesday’s reversal day to gain a whopping +306.98 points or +3.6%. At last night’s close of 8914.71, the Nasdaq has gained over 2000 points or +30% from the March 23 lows. It’s now just -10.1% below the all time highs from mid February.

Strong earnings from Alphabet Inc. (GOOG) 2 days ago were backed up by Microsoft Corp (MSFT) and Facebook Inc. (FB), both of which reported Q1 after the bell on Wednesday.

Anything and everything with exposure to Internet Commerce and Streaming Services has helped the Nasdaq sustain its rally the last 2 weeks. Having closed above its 200 day moving average 10 of the last 12 days, it now sports a +5.8% premium to that benchmark.

With the Nasdaq less than 100 points from the 9000 barrier, we’d typically say it was time for at least a pause in the rally. However, with standout earnings from both MSFT and FB after close last night — probably not today.

The Russell 2000 (^RUT) is now completely out of hibernation with a +4.8% gain Wednesday to close at 1360.76. The Russell has gained +15% in just the last 6 trading days, and has rallied +37.3% from its lows the third week of March. The Russell remains -20.2% below its 2020 high of 17.5.

The Early Line

Today is the last day of April. Oil is trading higher by +12% to +15%. Early trading in Stock Index futures show modest gains of up to +0.5%. Investors got everything they possibly could have asked for from the stock market this month. As much as the rally is due for a breather, it might be a few days away.

New York, N.Y. (PPD) — The month
NAR Expects Rebound, But Not Enough to Recover Spring Buying Season

A photo of a home pending for sale with sale pending on a realty sign. (Photo: AdobeStock)

Washington, D.C. (PPD) — The Pending Home Sales Index (PHSI) fell 20.8% in March, more than the consensus forecast. The National Association of Realtors (NAR) called all four regional drops “expected declines as a result of the coronavirus outbreak.”

Forecasts for ranged from a low of -15.0% to a high of 0.8%. The consensus forecast was -10.0. Year-over-year, contract signings declined 16.3%. An index of 100 is equal to the level of contract activity in 2001.

“The housing market is temporarily grappling with the coronavirus-induced shutdown, which pulled down new listings and new contracts,” said Lawrence Yun, chief economist for NAR. “As consumers become more accustomed to social distancing protocols, and with the economy slowly and safely reopening, listings and buying activity will resume, especially given the record low mortgage rates.”

The Northeast PHSI fell 14.5% to 82.3 in March, down 11.0% from a year ago. In the Midwest, the index decreased 22.0% to 85.6 last month, down 12.4% from March 2019.

“The usual Spring buying season will be missed, however, so a bounce-back later in the year will be insufficient to make up for the loss of sales in the second quarter,” Mr. Yun added. “Overall, home sales are projected to have declined 14% for the year.”

Pending home sales in the South declined 19.5% to an index of 103.7 in March, a 17.8% decline from March 2019. The index in the West plummeted 26.8% in March 2020 to 71.4, down 21.5% from a year ago.

Washington, D.C. (PPD) — The Pending Home

Coronavirus Mitigation Efforts Leads to First Negative Reading Under Trump Administration

GDP, Coronavirus (Covid-19) virus and economic crisis, symbolized by graph with word GDP going down to picture that coronavirus affects Gdp and leads to downturn and recession, 3d illustration. (Photo: AdobeStock)

Washington, D.C. (PPD) — The Bureau of Economic Analysis (BEA) reported the advance estimate for Q1 GDP in 2020 came in at -4.8%, worse than the consensus forecast. In Q4 2019, real GDP rose 2.1%.

Forecasts for ranged from a low of -7.0 to a high of -0.3. The consensus forecast was 3.7.

The decline in first quarter GDP was, in part, due to the response to the spread of COVID-19, as governments issued “stay-at-home” orders in March. This led to rapid changes in demand, as businesses and schools switched to remote work or canceled operations, and consumers canceled, restricted, or redirected their spending. The full economic effects of the COVID-19 pandemic cannot be quantified in the GDP estimate for the first quarter of 2020 because the impacts are generally embedded in source data and cannot be separately identified.

U.S. Bureau of Economic Analysis (BEA)

This is the first negative reading for GDP under the Trump Administration. Under the Obama Administration, the first quarter was either negative or very weak. It was a trend that — until now — had reversed under the current president.

Real consumer spending came in at -7.6%, missing the consensus forecast. The range was from a low of -6.3% to a high of -0.5%. The consensus was -1.5%.

This article will be updated shortly.

The Bureau of Economic Analysis (BEA) reported

A young woman consumer wearing a disposable medical mask while shopping at the supermarket during the Chinese Coronavirus (COVID-19) outbreak. (Photo: AdobeStock)

The Conference Board Consumer Confidence Index fell 31.9 points in April, but consumers’ short-term outlook improved. The Index now stands at 86.9 (1985=100) and follows a sharp decline in March from 118.8.

The historic low reading at 25.0 was measured during the Great Recession in February 2009. Forecasts ranged from a low of 65.0 to a high of 100.0. The consensus forecast was 90.0.

The Present Situation Index – based on consumers’ assessment of current business and labor market conditions – declined from 166.7 to 76.4. Those claiming business conditions are “good” decreased from 39.2% to 20.8%, while those claiming business conditions are “bad” increased from 11.7% to 45.2.

“Consumer confidence weakened significantly in April, driven by a severe deterioration in current conditions,” said Lynn Franco, Senior Director of Economic Indicators at The Conference Board. “The 90-point drop in the Present Situation Index, the largest on record, reflects the sharp contraction in economic activity and surge in unemployment claims brought about by the COVID-19 crisis.”

The Expectations Index – based on consumers’ short-term outlook for income, business and labor market conditions – improved from 86.8 in March to 93.8 this month. The percentage of consumers expecting business conditions will improve over the next six months increased from 18.7% to 40.0%. But those expecting business conditions will worsen also increased, from 16.4% to 25.7%.

“Consumers’ short-term expectations for the economy and labor market improved, likely prompted by the possibility that stay-at-home restrictions will loosen soon, along with a re-opening of the economy,” Franco added. “However, consumers were less optimistic about their financial prospects and this could have repercussions for spending as the recovery takes hold.”

“The uncertainty of the economic effects of COVID-19 will likely cause expectations to fluctuate in the months ahead.”

The Consumer Confidence Survey is conducted monthly and based on a probability-design random sample for the Conference Board by Nielsen. The cutoff date for the preliminary results was April 17.

The Conference Board Consumer Confidence Index fell

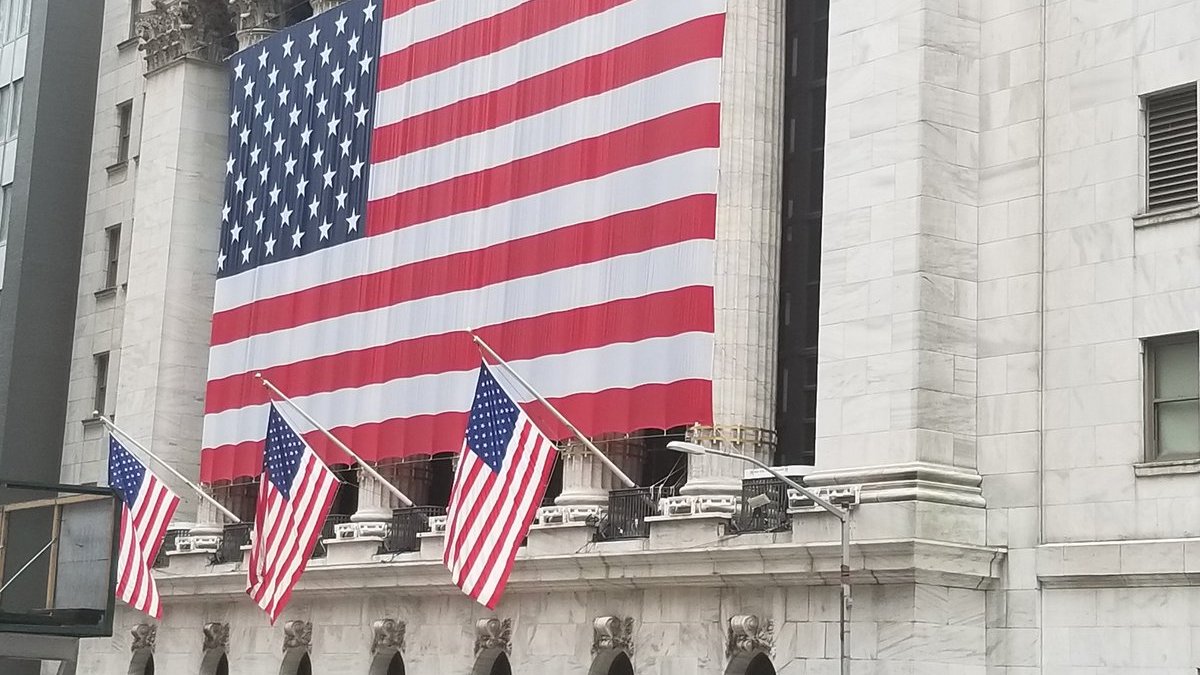
The New York Stock Exchange (NYSE) from the corner of Wall Street Nassau Street during the Conoravirus (COVID-19) outbreak on March 19, 2020. (Photo: People's Pundit Daily)
The New York Stock Exchange (NYSE) from the corner of Wall Street Nassau Street during the Conoravirus (COVID-19) outbreak on March 19, 2020. (Photo: People’s Pundit Daily)

New York, N.Y. (PPD) — Stocks began the week on a positive note as investors embraced the optimism of economies in much of Europe and at least a dozen U.S. states beginning to reopen.

While this is the busiest reporting week for Q1 earnings, investors are looking forward, even well beyond the obvious carnage that will be Q2 earnings, with expectations that the economy can get back on track more rapidly than many experts have forecasted.

The Dow Jones Industrial Average (^DJI) gained +1.5% to close at 24133.78, only the second time the index has closed above 24000 during this recovery rally. The Dow also closed above its 50 day moving average for the first time since February 21, literally the day before the Coronavirus sell off began.

While investors are clearly looking well beyond Q1 earnings, this is monster earnings reporting week that includes 40% of the companies in the DJIA. That being said, most companies have withdrawn any guidance for their 2020 full year results.

The S&P 500 (^SPX) rallied +1.5% to close at 2878.48, its highest close since March 10. Any further rally attempt by the S&P in the near term should meet significant resistance at the 2900 to 2950 level as there is a closing price gap in the chart between 2882 and 2954 that runs from the last day of February to March 10.

The fact that 30% of the S&P 500 reports earnings this week, again is on the back burner while investors focus on evaluating the timing and pace of the economic recovery.

The NASDAQ Composite (^IXIC), gained +1.1% to close at 8730.16, its highest close since March 5 this year. The Nasdaq closing above the 8700 marker comes 5 months to the day since its first ever close above that level on November 27 of last year. The Nasdaq begins Tuesday +3.7% above its 200 day moving average and has closed above that threshold 8 of the last 10 trading days.

This is a major earnings week for technology behemoths, most significantly three members of the Trillion Dollar Club; Alphabet Inc. (GOOG), which reports this afternoon after the close, Microsoft Corp (MSFT) reports Wednesday afternoon, and Amazon (AMZN) on Thursday afternoon.

The Russell 2000 (^RUT) was clearly the standout performer Monday, gaining +4% to close at 1281.88. Maintaining its current rally above the 1250 – 1260 level, will be a big positive toward repairing the extreme damage to the small cap index during the selloff in the second half of Q1. At its low on March 18, the Russell had declined -43% from its mid February highs

Stocks began the week on a positive

Watch Live 10:00 AM EST (PPD) — On this episode of ‘Inside The Numbers,’ we discuss states reopening rallying the markets and run a voter analysis in Colorado.

Subscribe to YouTube Channel!

Stories Discussed on the Show:

On this episode of ‘Inside The Numbers,’

Multiple Texas Manufacturing Indexes Fall to Historic Lows in April

The Texas Manufacturing Outlook Survey took another dive in April, though the headline number beat the consensus forecast. The Federal Reserve Bank of Dallas said the key production index fell from -35.5 in March to -55.3.

The general activity index fell from -70.0 in March to -73.7 in April. Forecasts for the headline ranged from a low of -85.0 to a high of -60.0. The consensus forecast was -80.0.

The new orders index fell 26 points to -67.0. That’s the lowest reading since the survey began in 2004. The growth rate of orders index fell to -62.2.

The capacity utilization and shipments indexes fell to -54.5 and -56.6, respectively. The capital expenditures index declined 20 points to -54.3. All of these readings are historical lows.

Unlike the Empire State Manufacturing Survey for the Northeast and Manufacturing Business Outlook Survey for the Mid-Atlantic, firms in Texas are pessimistic about the future.

The company outlook index remained near an all-time low even as it ticked up from -65.6 to -62.6. The index measuring uncertainty regarding companies’ outlooks retreated slightly to 54.4, still suggesting increased uncertainty.

The Texas Manufacturing Outlook Survey took another

Closed small businesses for coronavirus (COVID-19) pandemic, closure sign on retail store window banner background. (Photo: AdobeStock)

Washington, D.C. (PPD) — The Small Business Administration (SBA) resumes accepting applications for the Paycheck Protection Program (PPP) on Monday. On Friday, President Donald Trump signed the $484 billion “Phase 3.5” coronavirus stimulus bill, providing additional funding for PPP, as well as testing and hospitals.

“The PPP has supported more than 1.66 million small businesses and protected over 30 million jobs for hardworking Americans,” SBA chief Jovita Carranza and Treasury Secretary Steven T. Mnuchin said in a joint statement. “With the additional funds appropriated by Congress, tens of millions of additional workers will benefit from this critical relief.”

As People’s Pundit Daily (PPD) previously reported, Democrats’ attempts to leverage the crisis to obtain concessions for unrelated progressive agenda items cost the U.S. economy valuable time.

First, the initial Coronavirus Aid, Relief, and Economic Security Act, or the CARES Act, was stalled by Democrats demanding a laundry list of last-minute, leftwing provisions.

Then, Senate Democrats blocked an earlier attempt by Senate Republicans to replenish the PPP to the tune of $251 billion. The result was a 12-day delay, and small business and their workers have been paying the price. The PPP exhausted its funding one day before the two-week mark after banks began taking applications.

The “Phase 3.5” coronavirus stimulus bill includes $320 billion in additional funding for PPP, an additional $75 billion to fund hospitals and healthcare providers, and $25 billion for state-led COVID-19 testing.

Last Thursday, the U.S. Labor Department (DOL) reported initial jobless claims rose another 4.4 million for the week ending April 16. Roughly 27 million workers have filed for unemployment amid the coronavirus crisis. The advance seasonally adjusted insured unemployment rate rose to 11.0%, the highest level ever on record.

The forecasts for initial jobless claims for this week’s report — or, for the week ending April 23 — range from a low of 2 million to a high of 4.9 million. The consensus forecast is 3.5 million.

If the consensus holds, roughly 30 million Americans will have lost their jobs due to the mitigation efforts to slow the spread of the coronavirus. As of writing, for every one death in the U.S. due to the virus, roughly 600 jobs have been lost.

Funding for PPP originates at the Federal Reserve, flows from the Treasury Department to the Small Business Administration (SBA), which lends to the lender. Applicants apply for the loans and deal directly with their financial institutions.

“We encourage all approved lenders to process loan applications previously submitted by eligible borrowers and disburse funds expeditiously,” Administrator Carranza and Secretary Mnuchin added in a statement. “All eligible borrowers who need these funds should work with an approved lender to apply.”

On Monday, SBA will also resume processing Loan and Advance applications already in the queue on a first come, first-served basis. Learn more about coronavirus relief at the SBA, here.

“The Trump Administration is fully committed to ensuring that America’s workers and small businesses continue to get the resources they need to get through this challenging time.”

Washington, D.C. (PPD) — The Small Business

People's Pundit Daily
You have %%pigeonMeterAvailable%% free %%pigeonCopyPage%% remaining this month. Get unlimited access and support reader-funded, independent data journalism.

Start a 14-day free trial now. Pay later!

Start Trial