Widget Image
Follow PPD Social Media
Wednesday, January 8, 2025
HomeStandard Blog Whole Post (Page 32)

Speculation Over Health of Kim Jong Un Mounts After Online Reports

U.S. President Donald J. Trump shaking hands with North Korean Chairman Kim Jong Un during the US-DPRK nuclear summit in Singapore on June 12, 2018. (Photo: White House)

China has sent a team to North Korea including medical experts for Chairman Kim Jong Un, Reuters reported citing three people familiar with the situation. Two sources told the news agency a delegation led by a senior member of the Communist Party of China (PRC) International Liaison Department left Beijing for North Korea on Thursday.

The department is most responsible for dealing directly with neighboring North Korea. Reuters was unable to confirm what the trip meant for Chairman Kim’s health.

As People’s Pundit Daily (PPD) reported earlier this week, speculation over the health of the North Korean communist dictator has been running amok after online reports suggested it was on the decline after surgery.

Daily NK, an online newspaper run mostly by defectors based in South Korea, reported that Chairman Kim received a cardiovascular system procedure on April 12.

CNN reported the communist dictator was “in grave danger” after the surgery, citing a U.S. official with direct knowledge. Katy Tur at NBC News posted a tweet claiming Chairman Kim was “brain dead” before deleting it “out of an abundance of caution”.

Worth noting, intelligence gathering and media reporting on North Korea are notoriously difficult. The communist government keeps information close to the vest, particularly when dealing with leadership.

A U.S. official told PPD that concerns over Chairman Kim’s health are credible, but that it is difficult to assess the severity of his condition.

Chairman Kim, believed to be 36 years old, last appeared on North Korean state-run media on April 11. He presided over the Workers’ Party’s politburo. On April 15, North Korea held a national holiday marking the anniversary of the birthday of its founding father, Kim Il Sung.

But Chairman Kim was not in attendance for the ceremony celebrating his grandfather. Of note, the regime fired multiple short-range missiles during the ceremony, an event typically observed by the chairman.

In 2008, Kim Jong Il was absent from North Korea’s 60th anniversary, leading to similar speculation. It was later revealed he had a stroke. His health never fully recovered and in fact continued to decline until his death in 2011.

China has sent a team to North

Illustration of the stock market with the bull for a price growth and the bear for a price fall. The background is blue with a typical chart. (Photo: AdobeStock)

New York, N.Y. (PPD) — Stocks did close to a 2% round trip Thursday from their highs at 10:45 AM EDT to their lows, on the close at 4:00 pm. Just over a week ago, we laid out the coronavirus (COVID-19) trading reality that investors are writing off data on the macro economy and corporate earnings as largely irrelevant.

Stocks are trading off 1) technicals, 2) progress on fighting the virus, and 3) eco-political factors of which Oil is a major component. The first 2 weighed heavily on the market reversal Thursday.

The Dow Jones Industrial Average (^DJI) has a stubborn resistance level at 24000 that has turned beck rallies on 4 occasions over the last 2 weeks. Sure, it closed above 24000 a week ago today, but that was very short lived with the Dow losing 1200 points the following 2 days. Note the 50-day moving average (MA) at 24090.

The S&P 500 (^SPX) has serious resistance between 2850 and 2900. Note that the intraday high Thursday was 2844. This resistance level actually goes back to early March. While the 50 day MA is at 2818, that’s 45 points lower than a week ago when it was 2863.

The S&P 500 has been toggling that descending 50 day MA line 3 of the last 5 days. Going into next week we may very likely have an intriguing pattern where the S&P has support at the 50 day MA and resistance at the 2850 – 2900 level.

While the market rally Thursday was already stalled at these key resistance levels, it was a negative report on fighting the virus that kicked the headline reading algos into gear on the downside.

Gilead Sciences, Inc. (GILD) has a very promising drug called Remdesivir, that along with a few dozen other drugs is being tested by clinical labs and health agencies for a possible breakthrough as treatment for Covid-19.

Early afternoon Thursday, reports hit the wire that Remdesivir had failed badly in a test with over 350 Covid-19 patients. That caused an immediate plunge in stocks, 90% of which came from High Frequency Trading strategies, mindlessly reacting to their headline reading algorithms. Yes, Financial Market Structure in the U.S. is not only completely dysfunctional, but a total embarrassment.

The financial media of course went wild with the story, which blunted every rally attempt during the afternoon. The reality is that A) it was not a clinical trial, B) 90% of the patients were already on respirators, and/or with multiple comorbidities, and C) This was a “test” done in China!!….No, I’m not making this up!!

Stock markets are trading off 1) technicals,

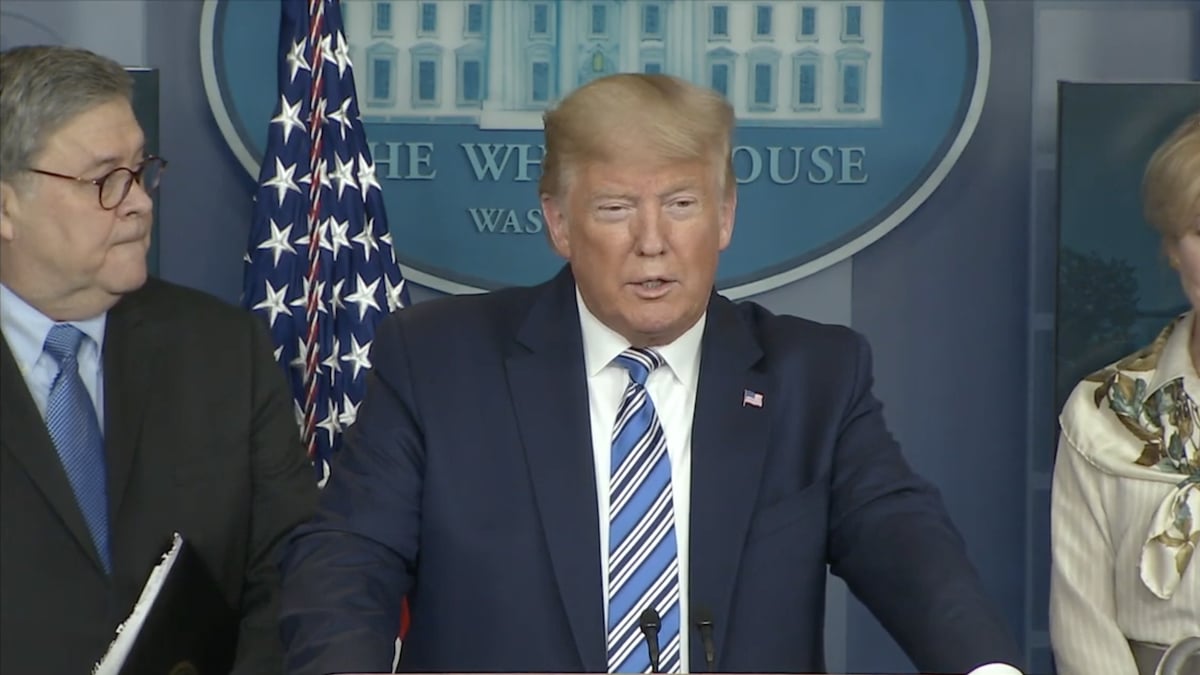
President Donald Trump and members of the Coronavirus Task Force, along with Attorney General William Barr, hold a press conference on March 23 2020. (Photo: People's Pundit Daily)
President Donald Trump and members of the Coronavirus Task Force, along with Attorney General William Barr, hold a press conference on March 23 2020. (Photo: People’s Pundit Daily)

Washington, D.C. (PPD) — President Donald Trump signed the $484 billion “Phase 3.5” coronavirus stimulus bill on Friday, providing funding for small businesses, testing and hospitals. The U.S. Senate passed the bill Tuesday night and the the U.S. House of Representatives approved it on Thursday.

As People’s Pundit Daily (PPD) previously reported, Democrats’ attempts to leverage the crisis to obtain concessions for unrelated progressive agenda items cost the U.S. economy valuable time. The Coronavirus Aid, Relief, and Economic Security Act, or the CARES Act, was stalled by Democrats’ demands to include a laundry list of last-minute, leftwing provisions.

Small businesses and their workers have been paying the price. The Paycheck Protection Program (PPP) exhausted its funding one day before the two-week mark after banks began taking applications.

As People’s Pundit Daily (PPD) also previously reported, Senate Democrats blocked an earlier attempt by Senate Republicans to replenish the PPP to the tune of $251 billion. They demanded $150 billion for states, $100 billion for hospitals and $60 billion for lenders like Community Development Financial Institutions (CDFI).

The “Phase 3.5” coronavirus stimulus bill includes $320 billion in additional funding for small businesses in the PPP, an additional $75 billion to fund hospitals and healthcare providers, and an additional $25 billion for state-led COVID-19 testing.

President Trump signed the $484 billion "Phase

The Survey of Consumers final reading on consumer sentiment for April beat the consensus forecast at 71.8. That’s up from the preliminary reading of 71.0 earlier this month.

Forecasts ranged from a low of 55.0 to a high of 71.0. The consensus forecast was 68.0.

The The Current Economic Conditions index came in at 74.3 and the Index of Consumer Expectations came in at 70.1.

“While the decline in both indices indicates an ongoing recession, the gap reflects the anticipated cyclical nature of the coronavirus,” said Richard Curtain, chief economist for the Survey of Consumers. “In the weeks ahead, as several states reopen their economies, more information will reach consumers about how reopening could cause a resurgence in coronavirus infections.”

What Mr. Curtain didn’t mention, however — or, perhaps doesn’t realize or understand — is that the mitigation efforts all but ensures at least a small resurgent in cases. That has always been the criticism of silenced medical voices during the crisis.

Absent a vaccine, herd immunity is the only option to expire any virus’ abilities to infect the population.

Final Results for April 2020

AprMarAprM-MY-Y
202020202019ChangeChange
Index of Consumer Sentiment71.889.197.2-19.4%-26.1%
Current Economic Conditions74.3103.7112.3-28.4%-33.8%
Index of Consumer Expectations70.179.787.4-1

The preliminary reading on consumer sentiment for May is scheduled to be released on Friday, May 15, 2020 at 10:00 AM EDT.

The Survey of Consumers final reading on

An exchange showing one hand giving cash to the another for new house and keys, a vector illustration for new home sales. (Photo: AdobeStock)

Washington, D.C. (PPD) — The new residential sales report found new home sales declined, but remained higher than as recent as May 2019 and February was revised higher.

New home sales were below 600,000 in May 2019.

New Home Sales

The U.S. Census Bureau and the Department of Housing and Urban Development reported jointly that sales of new single‐family houses in March 2020 came in at a seasonally adjusted annual rate of 627,000.

This is down 15.4% (±14.8%) from the upwardly revised February rate of 741,000 and down 9.5% (±14.6%) from the March 2019 estimate of 693,000.

Sales Price

The median sales price of new houses sold in March 2020 was $321,400. The average sales price was $375,300.

For Sale Inventory and Months’ Supply

The seasonally‐adjusted estimate of new houses for sale at the end of March was 333,000. This represents a supply of 6.4 months at the current sales rate.

The new residential sales report found new

COVID-19 Mitigation Efforts Crushed Historically Strong Labor Market

Washington, D.C. (PPD) — The U.S. Labor Department (DOL) reported initial jobless claims rose slightly more than expected by 4,427,000 for the week ending April 18, due to the mitigation efforts to slow the spread of the coronavirus (COVID-19). That’s a decrease of X from the previous week’s downwardly revised (-8,000) level of 5,237,000.

Forecasts ranged from a low of 3,000,000 to a high of 5,500,000. The consensus forecast was 4,250,000. Roughly 26 million Americans are now out of work as a result of the efforts to slow the spread of the coronavirus (COVID-19).

The 4-week moving average was 5,786,500, an increase of 280,000 from the previous week’s revised average. The previous week’s average was revised down by 2,000 from 5,508,500 to 5,506,500.

Lagging Jobless Claims Data

U.S. initial jobless claims graph on a tablet screen. (Photo: AdobeStock)

The advance seasonally adjusted insured unemployment rate rose again to 11.0% for the week ending April 11. This marks the highest level of the seasonally adjusted insured unemployment rate in the history of the seasonally adjusted series.

The previous high was recorded last week at 8.2% for the week ending April 4. The all-time high prior to that was 7.0%, recorded in May of 1975. Under the Trump Administration, this rate had fallen to an all-time low 1.1% and remained at 1.2% just weeks ago, before coronavirus (COVID-19) mitigation efforts.

The advance number for seasonally adjusted insured unemployment during the week ending April 11 was 15,976,000, an increase of 4,064,000 from the previous week’s revised level. This marks the highest level of seasonally adjusted insured unemployment in the history of the seasonally adjusted series. The previous week’s level was revised down by 64,000 from 11,976,000 to 11,912,000.

The 4-week moving average was 9,598,250, an increase of 3,548,000 from the previous week’s revised average. The previous week’s average was revised down by 16,000 from 6,066,250 to 6,050,250.

No state was triggered “on” the Extended Benefits program during the week ending March 28.

The highest insured unemployment rates in the week ending April 4 were in Michigan (17.4), Rhode Island (15.0), Nevada (13.7), Georgia (13.6), Washington (13.2), New Hampshire (12.2), Minnesota (11.9), New York (11.9), Montana (11.7), and Ohio (11.6).

The largest increases in initial claims for the week ending April 11 were in Colorado (+58,246), New York (+50,250), Missouri (+10,668), Florida (+10,534), and North Carolina (+2,733), while the largest decreases were in California (-263,342), Michigan (-166,347), New Jersey (-73,416), Georgia (-70,551), and Ohio (-66,874).

Initial jobless claims rose slightly more than

Illustration of the stock market with the bull for a price growth and the bear for a price fall. The background is blue with a typical chart. (Photo: AdobeStock)

Stocks staged a solid performance Wednesday, rallying +2% to +3% after a manic, two-day price decline in oil that rattled investors and sparked a 5% correction in major market averages.

It feels like the two day historic plunge in oil pricing earlier this week an epic exercise of capitulation selling. This was clearly complicated by the expiration of the May contract on Tuesday afternoon, and the lack of storage capacity creating major issues with taking physical delivery.

The Dow Jones Industrial Average (^DJI) rallied 456.94 or +2% to settle at 23475.82 after declining -5% the prior 2 days. The Dow was led by gains from McDonald’s Corp (MCD) at +$8.90 to $186.48, Apple Inc (AAPL) at $276.10, or +$7.73, and Visa Inc. (V) at $166.59, +$6.06.

The only decliner for the Dow was Boeing Co. (BA) at $134.97 -$1.36.

The S&P 500 (^SPX) gained 62.75 points, or +2.3% to settle less than a point shy of the 2800 threshold at 2799.31. The S&P had lost -138.00, or -4.8% Monday and Tuesday. The S&P 500 remains +25% above the March 23 lows and is 1% from its 50 day moving average of 2830.

All 11 sectors of the S&P 500 logged gains led by Information Technology, +3.9%, Energy, +3.6% and Utilities, +3%.

The NASDAQ Composite (^IXIC) continued its outperformance of late, with a +2.8% gain to settle at 8495.38. After losing -386.91 points the first two days this week, The Nasdaq recovered over half of that drop, gaining +232.15 on Wednesday.

The Nasdaq also regained its 200 day moving average, now having closed above that benchmark 5 of the last 7 trading sessions. The 200 day MA is at 8410.

Market internals lagged the averages a bit, with advancing issues leading decliners by less than 2½ to 1. The week began with decliners leading advancing issues by -3½ to 1 and -4 to 1, respectively. We would like to see market internals broaden out if the market is to extend Wednesday’s recovery rally.

The Early Line

Market averages have been bouncing between fractional gains and losses all morning. Crude oil trading to just below $16.00 is a positive, while the weekly unemployment claims report at 8:30 am will likely push the aggregate number above 25 million new filers over the last 4 weeks.

Stocks staged a solid performance Wednesday, rallying

People's Pundit Daily
You have %%pigeonMeterAvailable%% free %%pigeonCopyPage%% remaining this month. Get unlimited access and support reader-funded, independent data journalism.

Start a 14-day free trial now. Pay later!

Start Trial