Watch Live 10:00 AM EST (PPD) — On this episode of ‘Inside The Numbers,’ we discuss the three-phase plan for “Opening Up America Again”, and run a viewer choice voter analysis.
The White House unveiled a three-phase plan for “Opening Up America Again”, a set of guidelines to loosen restrictions to mitigate the coronavirus (COVID-19). The “science-based reopening” seeks to protect the vulnerable and target more impacted regions with mitigation efforts while allowing preventing a complete collapse of the U.S. economy.
“The United States has achieved a significantly lower mortality rate than most other nations,” President Donald Trump said a his daily press briefing with the Coronavirus Task Force. “Based on the latest data, our team of experts believes we can begin the next new front on the war.”
“America wants to be open and Americans want to be open.”
Each phase of the plan lays out guidelines for individuals, employers and specific types of employers. It comes as 30% of our country state-wise have reported no new cases over the last three days.
Phases One, Two and Three for Opening Up America Again (Source: White House)
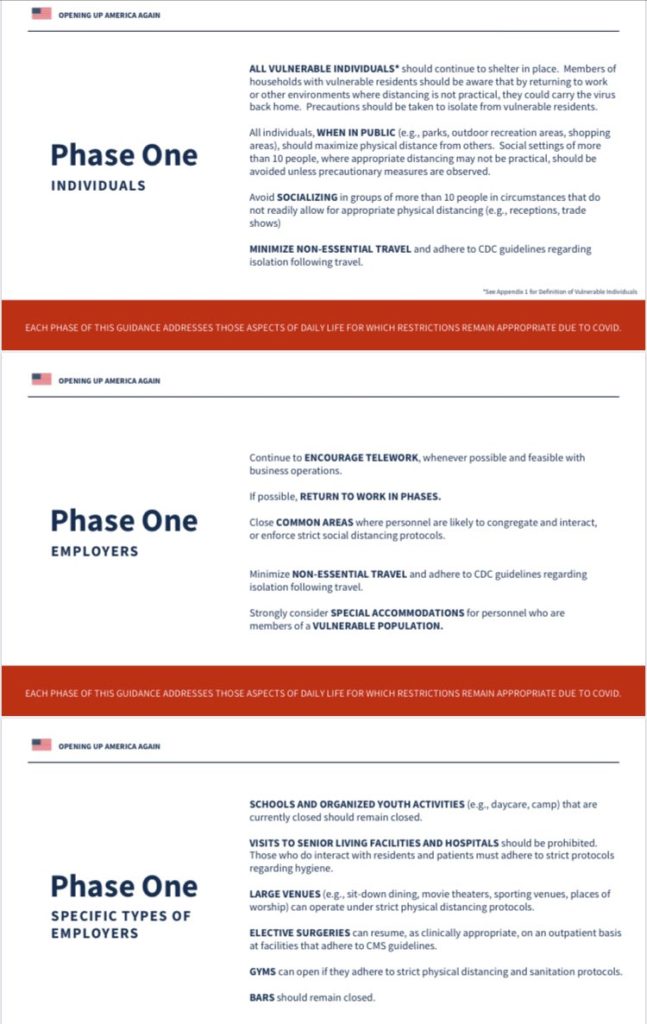
For individuals, Phase One calls for vulnerable individuals to continue to shelter in place and all individuals to continue to practice social distancing when in public. Individuals who go out in public but have vulnerable persons in the household should follow the guidelines laid out by the Centers for Disease Control (CDC).
Phases One for Opening Up America Again (Source: White House)
Minimal non-essential travel is permitted. Schools and school activities currently closed should remain closed.
“We are not opening all at once,” the president stressed. “But one careful step at a time. Some states will be able to open up before others.”
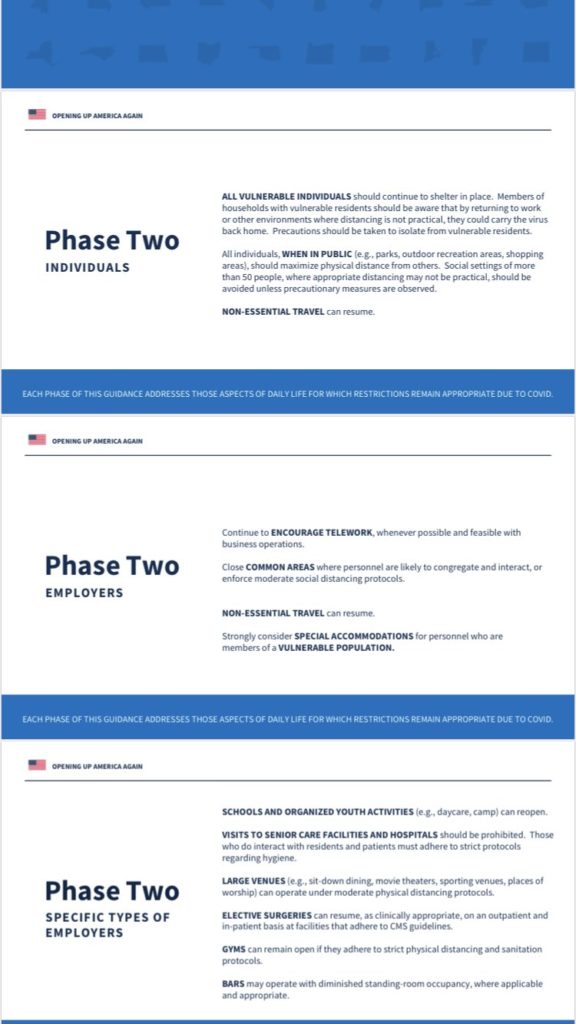
In Phase Two, all vulnerable individuals should continue to shelter in place. Schools in this phase can reopen, non-essential travel can resume and bars can reopen with diminished standing room occupancy.
Phases Two for Opening Up America Again (Source: White House)
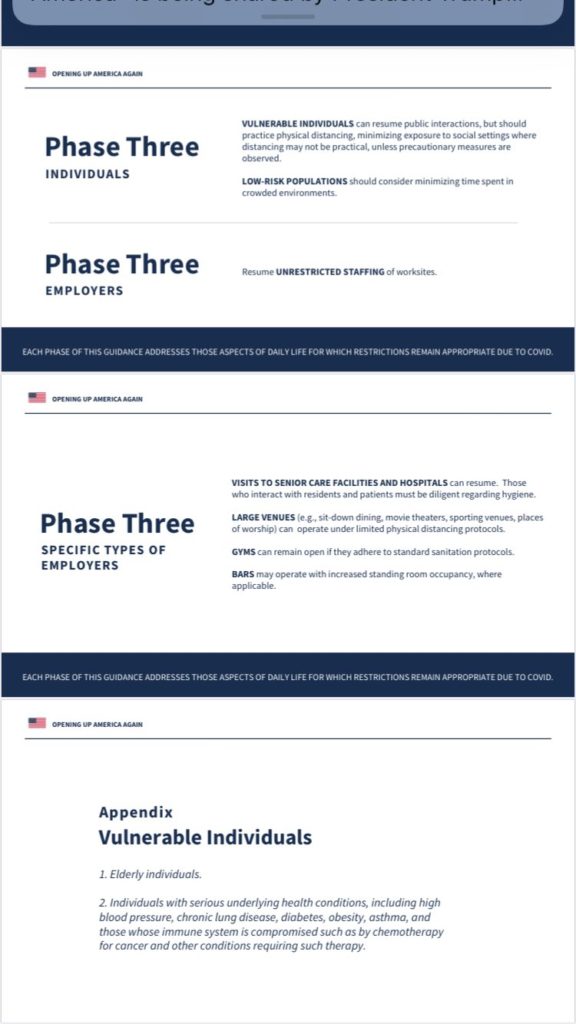
Phase Three is what Coronavirus Task Force leader Dr. Deborah Birx referred to as “a return to our new normal.” She stressed that no timeline was placed on any of the three phases to allow each state to implement each phase at their own pace.
Phases Three for Opening Up America Again (Source: White House)
Dr. Anthony Fauci, the Director of the National Institute of Allergy and Infectious Diseases, called the plan “robust.”
“This is a rather robust program for reentering normality,” he said. “The dominating drive on this was to make sure it was implemented in the safest way possible.”
The efforts to mitigate the spread of the coronavirus (COVID-19) have devastated what was a historically strong economy. Government investigators and several vaccine researchers now do not believe the virus originated from a wet market in Wuhan, China.
On Thursday, the U.S. Labor Department (DOL) reported initial jobless claims rose more than expected by 5,245,000 for the week ending April 16. The advance seasonally adjusted insured unemployment rate rose another 3.1% to 8.2%.
“As I’ve said, a national shutdown is not a sustainable solution,” the president added. “In order to preserve the health of our nation, we must preserve the economic health of our nation.”
The rash of extremely concerning economic data are all attributable to the mitigation efforts to slow the spread of the coronavirus (COVID-19). Industrial production posted the largest monthly decline since 1946.
“If we want to have a healthy population, we must maintain a working economy,” President Trump stated. “A prolonged lockdown combined with a forced economic depression would inflict an immense toll on the American people.”
“Our country has suffered. The world has suffered.”
Mid-Atlantic Manufacturing Firms Expect Overall Growth Over Next 6 Months, But Current Activity Lowest Since 1980
Philadelphia, Penn. (PPD) — The Philadelphia Federal Reserve’s Manufacturing Business Outlook Survey fell to a new low for April. But manufacturing firms see light at the end of the very dark tunnel.
Forecasts ranged from a low of -50.0 to a high of -22.0. The consensus forecast was -30.0.
Manufacturing Export Wooden Crate, reading Made in Pennsylvania. 3D Illustration. (Photo: AdobeStock)
The diffusion index for current activity declined for the second consecutive month from -12.7 in March to -56.6 this month. That’s below the lowest levels during the Great Recession.
This is the current activity index’s lowest reading since July 1980. At that time, the index came in at -57.1. The index for new orders fell further into negative territory, from -15.5 to -70.9, the lowest reading ever recorded.
The current shipments index fell 74 points to an all-time low. Unfilled orders fell 6 points further into negative territory, while delivery times rose 13 points to 4.1.
The firms reported widespread decreases in manufacturing employment this month, as the current employment index fell 51 points to -46.7, its lowest reading since March 2009. The average workweek index fell 55 points to -54.5, its lowest reading ever.
Light at the End of the Tunnel
Despite the current conditions, manufacturing firms remained optimistic about growth over the next six months. The diffusion index for future general activity rose 8 points to 43.0, largely erasing a 10-point decline last month. Over 53% of the firms expect increases in activity over the next six months, while 10% expect declines
Washington, D.C. (PPD) — New residential construction statistics for housing starts and building permits declined more than expected in March amid efforts to mitigate the coronavirus (COVID-19).
Builder confidence and residential construction, hew homes, housing starts, building permits, depicted on blueprints. (Photo: AdobeStock)
The new residential construction statistics report below is released jointly by the U.S. Census Bureau and the U.S. Department of Housing and Urban Development (HUD).
Housing Starts
Privately‐owned housing starts in March were at a seasonally adjusted annual rate of 1,216,000. This is 22.3% (±12.2%) below the revised February estimate of 1,564,000, but is 1.4% (±12.7%) above the March 2019 rate of 1,199,000.
Single‐family housing starts in March were at a rate of 856,000; this is 17.5% (±13.1%) below the revised February figure of 1,037,000. The March rate for units in buildings with five units or more was 347,000.
Building Permits
Privately‐owned housing units authorized by building permits in March were at a seasonally adjusted annual rate of 1,353,000. This is 6.8% (±1.1%) below the revised February rate of 1,452,000, but is 5.0% (±2.4%) above the March 2019 rate of 1,288,000.
Single‐family authorizations in March were at a rate of 884,000; this is 12.0% (±1.9%) below the revised February figure of 1,005,000. Authorizations of units in buildings with five units or more were at a rate of 423,000 in March.
Housing Completions
Privately‐owned housing completions in March were at a seasonally adjusted annual rate of 1,227,000. This is 6.1% (±12.0%) below the revised February estimate of 1,307,000 and is 9.0% (±12.4%) below the March 2019 rate of 1,348,000.
Single‐family housing completions in March were at a rate of 863,000; this is 15.0% (±11.6%) below the revised February rate of 1,015,000. The March rate for units in buildings with five units or more was 357,000.
Joe Biden, the presumptive Democratic nominee and former vice president, in an interview with George Stephanopoulos on ABC This Week on April 5, 2020.
Joe Biden made a comment that is being compared to Hillary Clinton’s infamous “deplorables” remark, stating Donald Trump’s voters support racism. In a virtual fundraiser with donors, Mr. Biden “laughed” that he had no plans to reach out to those voters in November.
“They really support the notion that, you know, all Mexicans are rapists and all Muslims are bad,” Mr. Biden said, adding they support “dividing this nation based on ethnicity, race.”
Biden quote tonight at a virtual fundraiser, compared to the famous Hillary Clinton "basket of deplorables" quote in full — with the distance of four years, not that different except for the "basket" phrasing: pic.twitter.com/Z71DCTqvNn
The first remark by the presumptive Democratic nominee refers to remarks the then-businessman made about immigration at his announcement speech on June 16, 2015. Big media widely reported Mr. Trump called Mexicans rapists, even that he called all Mexicans rapists.
As People’s Pundit Daily (PPD) reported, he said no such thing.
The U.S. has become a dumping ground for everyone else’s problems. It’s true. And these aren’t the best and the finest.
When Mexico sends its people, they’re not sending their best. They’re not sending you [pointing]. They’re not sending you [pointing].
They’re sending people that have lots of problems, and they’re bringing those problems with us. They’re bringing drugs. They’re bringing crime. They’re rapists and, some, I assume are good people. But I speak to border guards and they tell us what we’re getting.
Donald Trump, June 16, 2015
The second mark about muslims refers to a so-called registry allegedly supported by the then-Republican candidate. Hunter Walker at Yahoo! News derived that position from an interview, in which he never called for a registry.
Neither of those narratives had much of an impact on the election. However, the remarks Mrs. Clinton made about those who would support the president in wake of them, did.
Rich Baris, director of PPD’s Election Projection Model and host, said recently on ‘Inside the Numbers’ that Mr. Biden wasn’t making inroads with those white working class voters who supported President Trump in 2016 after Barack Obama in 2012.
“If Biden does do better [Pennsylvania], I don’t think it’ll be because he won back a whole lot of that particular voter [white working class]. I think it’ll be because he does better with… unaffiliated voters… in the burbs.”
A recent analysis by Nate Cohn in the The New York Times, agreed.
The results suggest that Mr. Biden, despite his reputed appeal to blue-collar workers, has made little to no progress in winning back the white voters without a college degree who supported Barack Obama in 2012 but swung to Mr. Trump in 2016… As a result, Mr. Trump appears to retain his relative advantage in the disproportionately white working-class battleground states that decided the 2016 presidential election.”
Watch Live 10:00 AM EST (PPD) — On this episode of ‘Inside The Numbers,’ we discuss the jobless claims amid COVID-19, and run a voter analysis in North Carolina.
Insured Unemployment Rate Now the Highest on Record as COVID-19 Mitigation Efforts Crush Historically Strong Labor Market
Washington, D.C. (PPD) — The U.S. Labor Department (DOL) reported initial jobless claims rose more than expected to 5,245,000 for the week ending April 11, attributable to the mitigation efforts to slow the spread of the coronavirus (COVID-19). That’s a decrease of 261,000 from the previous week’s upwardly revised (+9,000) level at 6,615,000.
Forecasts ranged from a low of 2,000,000 to a high of 8,000,000. The consensus forecast was 6,000,000.
The previous week’s average was revised up by 2,250 from 4,265,500 to 4,267,750.
Lagging Jobless Claims Data
U.S. initial jobless claims graph on a tablet screen. (Photo: AdobeStock)
The advance seasonally adjusted insured unemployment rate rose another 3.1% to 8.2% for the week ending April 4. This marks the highest level of the seasonally adjusted insured unemployment rate in the history of the seasonally adjusted series.
The previous high was 7.0% in May of 1975.
The advance number for seasonally adjusted insured unemployment during the week ending April 4 was 11,976,000, an increase of 4,530,000 from the previous week’s revised level. The previous week’s level was revised down by 9,000 from 7,455,000 to 7,446,000.
This marks the highest level of seasonally adjusted insured unemployment in the history of the seasonally adjusted series.
The 4-week moving average was 6,066,250, an increase of 2,568,500 from the previous week’s revised average. The previous week’s average was revised down by 2,250 from 3,500,000 to 3,497,750.
The highest insured unemployment rates in the week ending March 28 were in Rhode Island (11.9), Pennsylvania (9.8), Nevada (9.6), Washington (9.3), Connecticut (8.9), Massachusetts (8.7), Minnesota (8.7), Michigan (8.5), Ohio (8.4), and Georgia (8.2).
The largest increases in initial claims for the week ending April 4 were in Georgia (+256,312), Michigan (+84,219), Arizona (+43,488), Texas (+38,982), and Virginia (+34,872), while the largest decreases were in California (-139,511), Pennsylvania (-127,037), Florida (-58,599), Ohio (-48,097), and Massachusetts (-41,776).
The price of WTI Crude oil is falling. A red zig-zag arrow with an oil well pumpjack behind the word WTI on a blue background shows downwards, symbolizing a price fall or drop of the commodity. (Photo: AdobeStock)
New York, N.Y. (PPD) — Retail sales for March declined an astounding -8.7%. Industrial Production in March saw the largest decline since 1946. The Empire State Manufacturing report for April was -78.2 (NOT a typo).
Q1 earnings reports were equally breathtaking, as a hand full of banks added an aggregate $20 Billion to their loan loss reserves.
Guess what?
Not one investment professional was surprised by this. Briefing.com had consensus for March retail sales at -10% and their own private forecast at -12%. Industrial Production was forecast to be -4. It was -5.4%. When we get the revision for March retail sales, it will be revised to a double digit loss and no one will notice.
Economic forecasts and earnings estimates, for any or all of 2020 belong in the trash bin, not in print; either paper or digital, as they would if they have any predictive value.
Stocks are Trading off Technicals, Geo-Economic Data and Progress Fighting the Virus.
Technicals: Stock market averages had rallied between +25% and +30% in 3 weeks and a day since the March 23 lows. We were due for a pause. Even a retrace on half of that 3 week rally would be not only acceptable, but healthy.
Let’s take a closer look at Wednesday’s market:
The Dow Jones Industrial Average (^DJI) settled at 23504.35; -445.41 or -1.9%. That comes after a +2.4% gain on Tuesday.
The S&P 500 (^SPX) declined -62.70 or -2.2% to close at 2783.36. On Wednesday, the S&P 500 gained +3.1%. That’s a net gain of nearly +1% over 2 days…..We’ll take it!! Also let’s watch to see in 2800 becomes a meaningful resistance level on any further market strength the next few days.
The NASDAQ Composite (^IXIC) closed at 8393.18, a decline of -122.56, or -1.4%. The Nasdaq closed fractionally below the 200 day moving average of 8400. After a +4% gain on Tuesday, we’ll watch closely if that 200 day MA becomes an important technical inflection point the next few days.
Geo-Economic
Crude Oil WTI (CL) closed below the critical $20 benchmark for the first time since 2002. That was 2 years after the dot-com bubble burst in the early spring of 2000. The Energy sector had the worst performance; -4.7%, (followed by financials, -4.3%) among the 11 industry sectors in the S&P 500. If Oil can develop a meaningful move off the $20 level there will be critical long term damage to the global economy. Only a significant increase in demand will accomplish this.
Fighting the Virus
While Governor Cuomo proclaimed Wednesday that “the worst is behind us” we just had the 2 highest death count days nationally, since the onset of the crisis. While clearly deaths lag tallies for infection counts and hospitalizations, it was a depressing optic. We’ll look for more positive data on this front the remainder of this week and next.
Later today we will get updated guidelines from the CDC as a first step toward reopening the economy.
We got an early hint yesterday when Governor Cuomo issued an executive order that people in public places wear face masks when they are unable to adhere to social distancing guidelines. Read this as mass transit for starters!
I view this as a positive, not a draconian measure like we are seeing from other state governors……If you’re not on the verge of getting people back to
As With Industrial Production, Manufacturing Output Posts Biggest Decline Since 1946
Industry production 4.0 and technology concept, depicting factory production on a conveyor belt with factory operational workers in uniform. (Photo: AdobeStock)
Washington, D.C. (PPD) — The Federal Reserve Bank reported total industrial production fell 5.4% in March as the coronavirus (COVID-19) led many factories to suspend operations. That’s the largest monthly decline since January 1946.
Forecasts ranged from a low of -5.5% to a high of only -2.0%. The consensus forecast was -4.2%.
Manufacturing output fell 6.3% in March. That’s the largest monthly decline since February 1946. The largest decline came from motor vehicles and parts.
Forecasts for manufacturing output ranged from a low of -7.0% to a high of only -2.5%. The consensus forecast was -4.0%.
The indexes for utilities and mining declined 3.9% and 2.0%, respectively.
At 103.7% of its 2012 average, the level of total industrial production in March was 5.5% lower than a year earlier. Capacity utilization for the industrial sector fell 4.3 percentage points to 72.7% in March, a rate that is 7.1 percentage points below its long-run (1972–2019) average.
Forecasts for the capacity utilization rate ranged from a low of 69.8% to a high of only 75.3%. The consensus forecast was 74.0%.
Earlier Wednesday, the New York Federal Reserve reported the Empire State Manufacturing Survey showed factory activity in New York plunged to its lowest level ever in April.
Decline in New York Manufacturing Activity Surpasses Great Recession
Manufacturing Export Wooden Crate, reading Made in New York. 3D Illustration. (Photo: AdobeStock)
New York, N.Y. (PPD) — The New York Federal Reserve’s Empire State Manufacturing Survey showed factory activity in New York plunged to its lowest level ever in April. The headline general business conditions index fell 57 points to -78.2, its lowest level in the history of the survey by a wide margin.
Forecasts ranged from a low of -60.0% to a high of only -26.0%. The consensus forecast was -35.0%.
The previous low recorded was -34.3 during the Great Recession. Only 7% of New York manufacturing firms reported that conditions improved over the month, while 85% reported that conditions had worsened. The new orders index fell 57 points to -66.3, while the shipments index fell 66 points to -68.1.
The index for number of employees tanked 54 points to -55.3, with nearly 60% of respondents indicating lower employment. The average workweek index fell to -61.6, with 65% reporting shorter workweeks. The prices paid index fell 19 points to 5.8 and the prices received index fell to -8.4, pointing to a decline in selling prices for the first time since 2016.
Still, while firms anticipate only a small improvement in business conditions over the next six months, it’s a rosier outlook than the prior month. The index for future business conditions increased 6 points to 7.0.
You have %%pigeonMeterAvailable%% free %%pigeonCopyPage%% remaining this month. Get unlimited access and support reader-funded, independent data journalism.