Thanks to Feckless Tories, the United Kingdom Is Poised to Fall Off the Wagon of Fiscal Sobriety

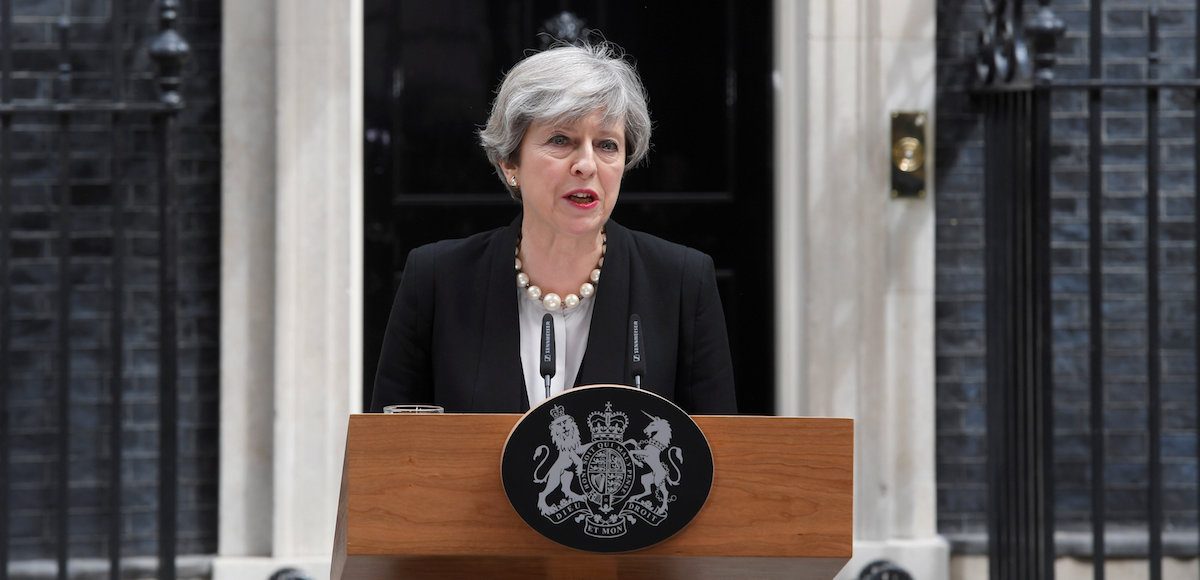
British Prime Minister Theresa May speaks about the suicide bombing at the Manchester Arena outside 10 Downing Street in London, May 23, 2017. (Photo: Reuters)
One of my favorite charts shows how nations achieve great results when they engage in multi-year periods of spending restraint.
The most important benefit is that the burden of government shrinks relative to the private sector, but it’s also worth noting that the symptom of red ink begins to disappear when there is a serious effort to deal with the underlying disease of excessive spending.
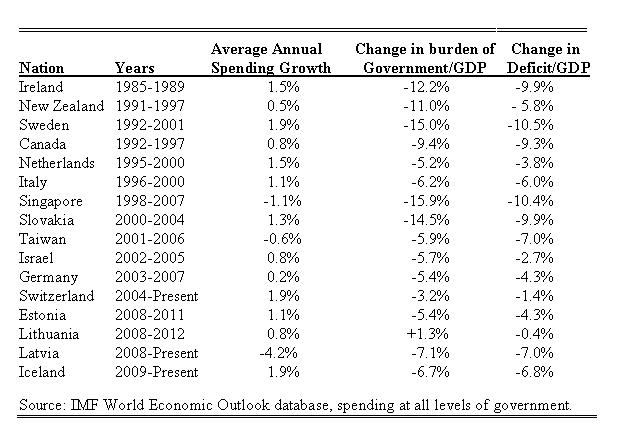
Source: IMF World Economic Outlook database.
But sharing this chart also a bittersweet experience since it shows – in almost all cases – that it is just a matter of time before politicians go back to fiscal profligacy.
This is why I’m a huge fan of a permanent spending cap, ideally as part of a nation’s constitution. Jurisdictions that have adopted this approach, such as Hong Kong and Switzerland, have very strong long-run fiscal performance rather than just temporary blips of good policy.
At the risk of understatement, it’s increasingly obvious that the United Kingdom needs this kind of permanent structural reform.
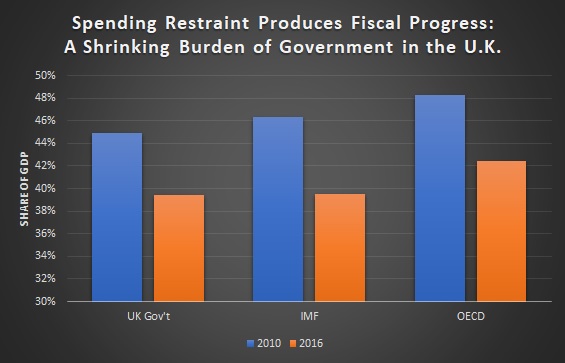
As you can see from this chart I shared back in February, there’s been some decent spending restraint in that country ever since 2010.
Let’s augment those numbers.
I pulled together the data on government spending from the Organization for Economic Cooperation and Development (OECD), the International Monetary Fund (IMF), and the UK government. They all have slightly different methodologies with slightly different numbers, but they all tell the same story.
Since 2010, the burden of government spending has expanded by an average of about 1.6 percent annually. Spending is still growing, needless to say, but the private sector has been growing faster, so British policymakers have been satisfying my golden rule.
And because the productive sector of the economy has grown faster than government, this means that relative burden of spending has declined. Which is exactly what we see in this chart.
That’s the good news.
The bad news is that politicians are tired of being responsible. They are salivating at the prospect of a new spending binge. Even Tory politicians now want to play Santa with other people’s money.
The U.K.-based Times has some of the unpleasant details.
Ministers are pushing to delay or abandon a series of tax cuts to fund an increase in public sector pay, The Times has learnt. Philip Hammond, the chancellor,
is being urged to scrap commitments to reduce corporation tax and raise the thresholds for the personal allowance and the 40 per cent income tax rate. …At a meeting of the political cabinet last week, Jeremy Hunt, the health secretary, Justine Greening, the education secretary, and Sir Patrick McLoughlin, the party chairman, are understood to have called for more money for public sector workers.
Opening the spending spigot would be a terrible mistake. Especially to finance higher pay for bureaucrats.
The Wall Street Journal recently opined on this new threat to fiscal responsibility on the other side of the Atlantic.
…the Prime Minister’s Tories now want to abandon their claim to fiscal discipline. Rather than blame a feckless campaign, wobbly Tory leaders have decided that voters are exhausted with “austerity” and government employees are happy to step in with spending demands. Those government workers and their patrons in the opposition Labour Party are demanding an end to the 1% annual pay-rise cap imposed by former Prime Minister David Cameron and Chancellor George Osborne in 2013 after several years of pay freezes.
Even worse, they want to cancel tax cuts and/or impose tax hikes to finance more money for the bureaucracy.
…cabinet grandees Boris Johnson and Michael Gove…seem willing to pay for it by reducing scheduled corporate tax-rate cuts or increasing individual taxes by reducing the threshold at which the second-highest 40% rate applies.
You won’t be surprised to learn that British bureaucrats are not underpaid compared to workers in the economy’s productive sector.
Britain’s government workers aren’t suffering from a pay crisis compared to their peers in the private (that is, productive) economy. For most of the period since 2000, average weekly nominal earnings for public employees have exceeded the private average, according to the Office for National Statistics. And that excludes government pensions that are far more generous than what most private employees enjoy. Government workers were also shielded from the worst of the post-2008 downturn. The 1% cap amounted to steady nominal wage growth while private wages fell sharply…. Government workers were also spared the worst of the job cuts private employers imposed. …The 1% nominal pay cap mainly has given private workers an opportunity to catch up to government pay. …Voters are frustrated by an economic recovery that has largely failed to deliver inflation-adjusted earnings growth. But the solution isn’t to further stifle wage growth in the private economy by raising taxes to benefit public employees.
Tim Worstall also explains that the bureaucracy is not suffering from a lack of compensation.
We’ve just had a massive recession and thus we are indeed worse off. That’s what a recession is all about. So the question should be: are we all sharing that pain? We are not. Public sector pay has fallen by less than private. The people paying the tax have suffered more than those who eat the tax – hardly a good argument in favour of tax-eater pay rises. …It is also true, as the IFS points out, that public sector pay rose substantially in the 2000 to 2005 period. Pay rose more and then pay fell less. I simply can’t see an argument for a public sector pay rise or the lifting of that cap here.
My colleague at the Cato Institute, Ryan Bourne, is a citizen of the United Kingdom, and he points out that one of the problems is that bureaucrat pay levels are determined nationally, which makes no sense when the cost of living varies widely across the country.
….they should phase out national pay bargaining where it remains in the public sector. Previous research by Allison Wolf has shown the high cost of having national pay scales and bargaining. …Poorer regions…suffer as very high pay relative to the private sector crowds out private sector growth.
Ryan explains that Sweden successfully adopted this reform.
Sweden shows the solution. There, collective bargaining was entirely replaced by individual contracts between staff and their local public sector employer, with little fuss. If applied here, managers would then have genuine flexibility in the creation of new posts. It would liberate them to set pay to reflect more accurately local conditions, while varying wages to fulfil difficult positions.
Of course, the ideal situation would be genuine federalism, with local communities raising their own funds and then deciding how lavishly to compensate the bureaucrats they hire. The U.K. actually took a baby step in that direction years ago by giving greater autonomy to Scotland.
I’ll close with a rather depressing observation. It was only two months ago that I suggested Tories might be poised to make big policy improvements in the United Kingdom. Now it appears that they’ll be competing with the Labour Party on how to spend other people’s money. The great Margaret Thatcher is probably spinning in her grave.
Since 2010, government spending in the United