Widget Image
Follow PPD Social Media
Thursday, January 9, 2025
HomeStandard Blog Whole Post (Page 35)

NAHB Expects Housing Market to Lead Recovery Post-Social Distancing

Real Estate Market Going Down Concept Illustration. (Photo: AdobeStock)

Washington, D.C. (PPD) — The NAHB/Wells Fargo Housing Market Index (HMI) finds builder confidence tumbled by a historic 42 points in April to 30. Builder confidence in the market for newly-built single-family homes fell amid rising concerns surrounding the impact of mitigation efforts to combat the Chinese Coronavirus (COVID-19).

Forecasts ranged from a low of 53 to a high of 68. The consensus forecast was 60. Prior to the pandemic, the HMI was soaring to historic levels and backed by strong new residential construction statistics.

“This unprecedented drop in builder confidence is due exclusively to the coronavirus outbreak across the nation, as unemployment has skyrocketed and gaps in the supply chain have hampered construction activities,” said NAHB Chairman Dean Mon. “Meanwhile, there continues to be some confusion over builder eligibility for the Paycheck Protection Program, as some builders have successfully submitted loan applications while others have not been able to.

The NAHB is working with the White House, the U.S. Treasury and U.S. Congress to get the broadest builder participation possible in the program. However, Democrats railroaded legislation funding another 250 billion for it. House Speaker Nancy Pelosi, D-Calif., is refusing to call members back until at least the first week of May.

“Home building remains an essential business throughout most of the nation, and as the pandemic shows signs of easing in the weeks ahead, buyers should return to the marketplace,” Mr. Mon said.

The NAHB/Wells Fargo Housing Market Index (HMI) is a monthly survey gauging builder perceptions of current single-family home sales and sales expectations for the next six months as “good,” “fair” or “poor.” It also asks builders to rate traffic of prospective buyers as “high to very high,” “average” or “low to very low.”

Scores for each component are used to calculate a seasonally adjusted index where readings over 50 indicate more builders view conditions as good than poor.

“Before the pandemic hit, the housing market was showing signs of strength with January and February new home sales at their highest pace since the Great Recession,” said NAHB Chief Economist Robert Dietz. “To show how hard and fast this outbreak has hit the housing sector, a recent poll of our members reveals that 96% reported that virus mitigation efforts were hurting buyer traffic.”

The HMI index gauging current sales conditions dropped 43 points to 36, the component measuring sales expectations in the next six months fell 39 points to 36 and the gauge charting traffic of prospective buyers also decreased 43 points to 13.

“While the virus is severely disrupting residential construction and the overall economy, the need and demand for housing remains acute,” Mr. Dietz added. “As social distancing and other mitigation efforts show signs of easing this health crisis, we expect that housing will play its traditional role of helping to lead the economy out of a recession later in 2020.”

The HMI survey was conducted between April 1 and April 13.

The NAHB/Wells Fargo Housing Market Index (HMI)

A young woman consumer wearing a disposable medical mask while shopping at the supermarket during the Chinese Coronavirus (COVID-19) outbreak. (Photo: AdobeStock)

Washington, D.C. (PPD) — The advance estimate for U.S. retail sales for March came in at $483.1 billion, down 8.7% (±0.4%) monthly and 6.2% (±0.7%) year-over-year. Estimates are adjusted for seasonal variation and holiday and trading-day differences, but not for price changes.

Forecasts ranged from a low of -13.2% to a high of only -3.3%. The consensus forecast was -7.3%.

Total sales for the January 2020 through March 2020 period were still up 1.1% (±0.5%) from the same period a year ago. However, that’s down significantly from the gains before the mitigation efforts to stop the spread of the Chinese Coronavirus (COVID-19).

The January 2020 to February 2020 percent change was revised from down 0.5% (±0.4%) to down 0.4% (±0.2%).

Retail trade sales were down 6.2% (±0.4%) from February 2020, and 3.8% (±0.7%) below last year. Food and beverage stores were up 28.0% (±0.9%) from March 2019, and 25.6 from the previous month. That includes a 26.9% monthly gain for grocery stores.

Clothing and clothing accessories stores were down 50.7% (±1.8%) from last year.

SOURCE: U.S. CENSUS BUREAU ADVANCE MONTHLY SALES FOR RETAIL AND FOOD SERVICES, MARCH 2020

The advance estimate for U.S. retail sales

Watch Live 10:00 AM EST (PPD) — On this episode of ‘Inside The Numbers,’ we discuss the market reaction to earnings season amid COVID-19, and run a voter analysis in Arizona.

The People’s Pundit Rich Baris and Wall Street’s Tim “The Source” Anderson will also discuss Barack Obama endorsing Joe Biden, the deal for the airlines amid the coronavirus shutdown, and much more.

Watch Live 10:00 AM EST (PPD) —

Illustration of the stock market with the bull for a price growth and the bear for a price fall. The background is blue with a typical chart. (Photo: AdobeStock)

New York, N.Y. (PPD) — Earnings season got off to a well-anticipated bad start, and the stock market couldn’t have cared less. Yes, banks and financials underperformed, as JPMorgan Chase; JPM $95.50, -$2.69 or -2.7% and Wells Fargo, WFC, $30.18 -$1.25, or -4% significantly increased loan loss reserves for the fiscal year in addition to reporting sharp declines in Q1 earnings.

The JPM CFO spoke of the challenges facing the bank in preparing for an unprecedented decline in GDP of as much as -40% and a spike in unemployment that could reach 20%. Not at all discounting the severity of current conditions, it was a textbook example of managing expectations.

Investors were looking out to the horizon and even beyond, as the Coronavirus infection rate seems to be slowing, hospital discharges are running ahead of new admittances, and the concern over shortages of masks, gowns, and medical equipment is not nearly at the frenzy of a few weeks ago.

The last 3 weeks the stock market has transitioned from a reflex rally off an extremely oversold condition, to a level that is arguably a bit ahead of itself in the immediate term. While the NASDAQ Composite (^IXIC) rallied above its 200 day moving average Tuesday, the Dow Jones Industrial Average (^DJI) and S&P 500 (^SPX) remain at -10% and -5% deficits, respectively.

That’s a heavy lift for big time market averages that have already rallied between +25% and +30% in the last 3 weeks.

Oil is still struggling to find a base. While the OPEC+ production cut agreement negotiated over the weekend is certainly not a negative, it received a “sell on the news” reaction from markets. Prices declined nearly -10% Tuesday, leaving NYMEX Oil just above $20 per barrel. While the agreed to production cuts of 9.7 million barrels/day were less than what some had hoped for, the crude reality is that until economic activity around the globe is kicked into at least 2nd gear, there is an overwhelming over supply of Oil everywhere.

Early Wednesday Oil has broken below the $20 threshold, putting pressure on global stock markets in early trading.

Tuesday Market Recap

The Dow Jones Industrial Average (^DJI) added +558.99 points, or +2.4% while closing just shy of the 24K threshold at 23949.76. The DJIA has rallied +29.1% in the 3 weeks since the March 23 low of 18552. 

The Blue Chip Average was led by Apple, Inc. (AAPL) closing at $287.06, +$13.80; Home Depot Inc. (HD) at $207.17, +$8.38; Microsoft Corp. (MSFT) $173.70, +$8.19; UnitedHealth Group Inc. (UNH) $270.50, +$6.99; and Johnson and Johnson; (JNJ) $146.03, +$6.26. 

The decline from the mid February high of 29551.42 stands at -18.9%    

The NASDAQ Composite (^IXIC) gained +323.32 points, or +4% to close at 8515.74. The NASDAQ regained both its 50 and 200 day moving averages almost 5 months to the day after closing above 8500 for the first time ever. The tech heavy index was led by Amazon.com, Inc. (AMZN), Microsoft Corp; (MSFT), and Apple Inc; (AAPL) all with gains of +5% or more, while AMZN posted an all-time-high (ATH) of $2283.32 gaining +$114.45.

The NASDAQ has rallied +24.1% in 3 weeks from its March 23 low.    

The S&P 500 (^SPX) rallied +84.43, or +3.1% to close at 2846.06. Within the broad based index, the Consumer Discretionary and Information Technology sectors led the charge, each gaining +4.2%. On the flip side, Financials, +0.3% and Energy, -0.5% notably lagged. The S&P has gained +27.2% from its low  just over 3 weeks ago, and remains at a -16%  deficit to its ATH of 3386.15 in mid February.

The Early Line:

Oil is -2% lower this morning, trading in the mid $19 range as the IEA is projecting that demand for oil is likely to fall by a record amount in the second quarter.   

Most global stock markets are lower by ~2%. Trading in U.S. stock market futures are projecting early declines of -1.5% to -2%.  

While investors have been optimistically looking beyond the current conditions, we likely need more clarity on the details and timing for reopening the economy to hold the levels achieved by the recent rally.

Earnings season got off to a well-anticipated

Graphic concept of the NASDAQ Composite (^IXIC) in the green for gains. (Photo: AdobeStock)

New York, N.Y. (PPD) — On Tuesday, the NASDAQ Composite (^IXIC) closed above its 200-day moving average for the first time since March 6, after rallying +323.32 points; or +3.95% to close at 8515.74. The 200-day moving average began the day at 8398.

The 50 day moving average has been declining since shortly after the market selloff began in late February and stands at 8418. 

Prior to March 6, the last time the NASDAQ traded below the 200 day moving average was May 31, 2019. At that time, it closed below its 200 day MA for merely 2 days. At the end of May, 2019 the 200 day MA was at 7525.

The NASDAQ composite has rallied +15.5% over a 6 day stretch of consecutive gains. On March 23, the NASDAQ, the Dow Jones Industrial Average (^DJI), and S&P 500 (^SPX) all hit closing lows for the current sell off.

At today’s close, the NASDAQ has rallied +24% in three weeks since those lows. The S&P 500 and DJIA each remain at least 5% below their 200 day MAs.

On Tuesday, the NASDAQ Composite (^IXIC) closed

Voting, elections and state polls concept: Ballot box with state flag in the background - Wisconsin. (Photo: AdobeStock)
Voting, elections and state polls concept: Ballot box with state flag in the background – Wisconsin. (Photo: AdobeStock)

Liberal Jill Karofsky has defeated conservative incumbent Daniel Kelly in the Wisconsin Supreme Court election. Wisconsin held its presidential primary and statewide general elections on April 7, though the results were reported Monday.

CandidateVotesPct.
Jill Karofsky629,70353.2%
Daniel Kelly*554,84846.8
74% reporting; 1,184,551 votes, 2,909 of 3,937 precincts reporting

* Incumbent

Lisa Neubauer, a liberal who lost the race for Wisconsin Supreme Court against conservative Jim Hagedorn in 2019, held her seat for the Court of Appeals in District 2.

Kenosha County really tells the story in Wisconsin. As of writing, Karofsky carried the important swing county with 58.5%m or 15,020 votes. In 2019, Judge Hagedorn won it with 52%. Donald Trump won it in 2016.

Kelly ran behind Hagedorn almost across the board. Voting drop offs for the conservative candidate in Trempealeau, Jackson, Washington and other counties indicated a clear turnout edge for Democrats and liberals.

Of the 10 largest counties in Wisconsin, Karofsky slipped Winnebago by the slimmest of margins. But it was one more data point to suggest an outperformance.

On April 6, the Wisconsin Supreme Court ruled that Democratic Governor Tony Evers did not have the authority to delay in-person primary voting. The 4-2 ruling — split along ideological lines with 4 conservatives against and 2 liberals for— meant the primary would still be held in-person.

Liberal Jill Karofsky has defeated conservative incumbent

Joint Fundraising Haul Fueling Largest GOTV Data Operation in Party’s History

President Donald J. Trump speaks to young conservative activists at CPAC 2020 in National Harbor, Maryland on February 29, 2020. (Photo: People's Pundit Daily)
President Donald J. Trump speaks to young conservative activists at CPAC 2020 in National Harbor, Maryland on February 29, 2020. (Photo: People’s Pundit Daily)

Washington, D.C. (PPD) — President Donald J. Trump and the Republican National Committee (RNC) jointly raised more than $212 million in the first quarter (Q1) of 2020. That’s $56 million — and 36% — more than their fundraising haul in Q4 2019.

The Trump campaign and the RNC joint committees raised more than $63 million in the month of March alone. The figure for Q1 2020 brings the total cycle-to-date fundraising haul to over $677 million.

“Americans can see President Trump leading this nation through a serious crisis and they are responding with their continued enthusiastic support for his re-election,” Brad Parscale, the president’s campaign manager said. “Joe Biden, Democrats, and the media continue to oppose his every action, but the people know that President Trump is fighting for them so they are fighting for him as well.”

That is $270 million more than Barack Obama raised for his re-election effort at this point in 2012. The Trump and RNC campaign committees have more than $240 million cash on hand (CoH).

“President Trump’s unyielding commitment to the American people has shown time and again that he is the President we need to lead our country through this crisis, and it’s clear that voters are responding to his bold leadership,” RNC Chairwoman Ronna McDaniel. “The enthusiasm for President Trump and our Party remains strong, and we continue to be all systems go toward November.”

The massive record-breaking hauls are being used to fund the largest field program and data operation in the party’s history. As a joint effort, the operation foc

Late last week, the campaign and committee reported record-breaking voter contacts even amid social distancing guidelines. Trump Victory, which transitioned to a virtual voter contact operation in only 24 hours, deployed “Trump Talk” for more than 880,000 trained volunteers to use to reach voters in the comfort of their own homes.

The volunteers army has made over 17 million voter contacts since March 13. Last week, they hosted 600 training sessions and made 4 million virtual voter contacts, alone.

The Trump campaign and Republican National Committee

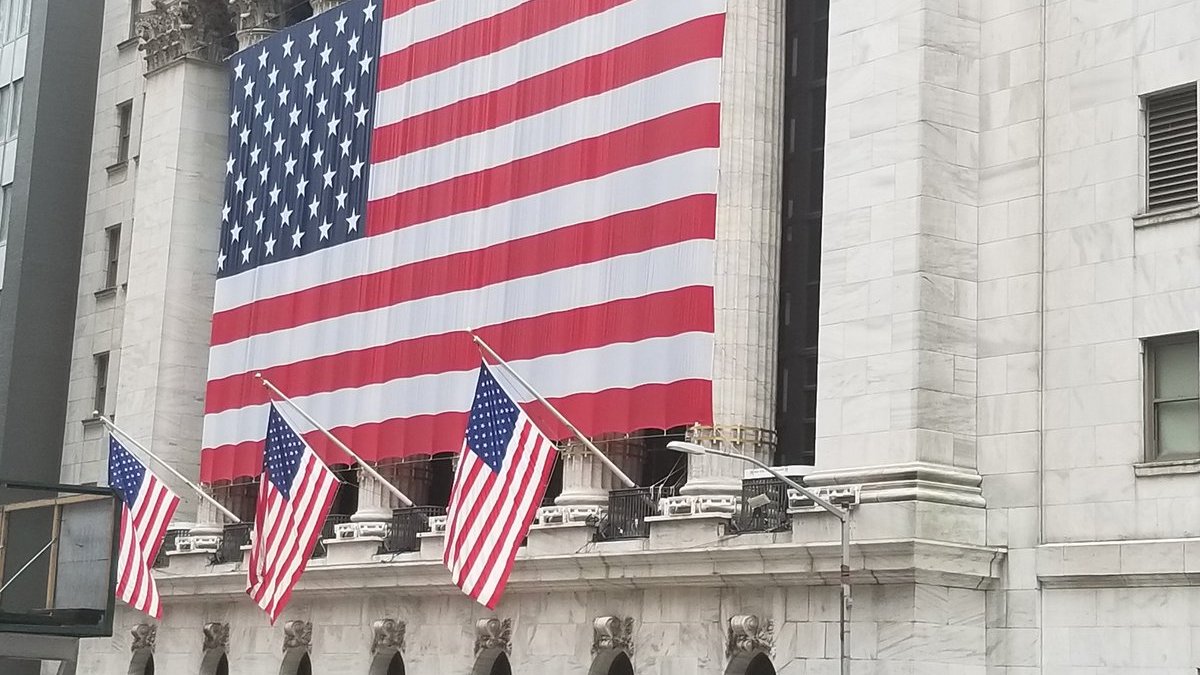
The New York Stock Exchange (NYSE) from the corner of Wall Street Nassau Street during the Conoravirus (COVID-19) outbreak on March 26, 2020. (Photo: People's Pundit Daily)
The New York Stock Exchange (NYSE) from the corner of Wall Street Nassau Street during the Conoravirus (COVID-19) outbreak on March 26, 2020. (Photo: People’s Pundit Daily)

New York, N.Y. (PPD) — As first quarter (Q1) earnings reports kick into full gear this week, their impact will be marginal, at best. Stocks are trading off a mix of technical data on both market averages and progress on fighting the coronavirus (COVID-19). Projections for both corporate earnings and the macro economy have clearly become dependent on when and how we come out from current shuttering a large majority of our economic activity.

The stock market staged a four-day rally last week, as the U.S. Federal Reserve took additional measures to stave off personal and corporate defaults. Further, we began to get data indicating the spread of the coronavirus may be peaking in the most densely hit population zones.

Despite the holiday shortened week, Major Stock Market Indices posted gains ranging from +10.6% for the NASDAQ composite to +12.7% for the Dow Jones Industrials, leaving all of the 3 benchmark averages with declines of less than -20% from their all time highs in mid February.

Seven trading days into April, market averages are at their best levels since March 10, five days before the Trump administration rolled out their initial “Stop the Spread” social distancing guidelines.

Market Internals were equally impressive. On both Monday, the 6th and Wednesday the 8th, we had +90% Up Volume days, paired with advance/decline stats that were positive by +10 to 1 on Monday and better than +8 to 1, 2 days later.

The Dow Jones Industrial Average (^DJI) rallied +12.7% last week to close at 23719.37. The Dow Jones has rallied +27.8% in 3 weeks from the March 23 low. The Dow is -19.7% below its all time high of 29552 in mid February.

The The S&P 500 (^SPX) rallied +301.21 points, or +12.1% to close at 2789.82. The S&P has rallied +24.7% from the March 26 low, and is -18.8% lower than its all-time-high (ATH) from mid February. Last week saw the largest weekly gain for the S&P 500 since October 1974, over 45 years ago.

Just to put 1974 in perspective, President Richard M. Nixon resigned the Presidency in early August. Ten weeks later, the stock market bottomed out in mid October with the Dow Jones between 580.00 and 590.00.

That is not a typo. In mid October, 1974, the Dow reached a secular low below 600.00.

The NASDAQ Composite (^IXIC) rallied +10.6% last week to close at 8153.58. Last Wednesday and Thursday was the first time the Nasdaq closed above the 8000 level on consecutive days since March 5 and 6. The first close ever above the NASDAQ 8000 level came just less than a year ago on April 16, 2019. The Nasdaq has rallied +18.8% from the March 23 low, and remains at a -17.6% decline from its mid February peak of 9817.18.

Stocks are trading off a mix of

People's Pundit Daily
You have %%pigeonMeterAvailable%% free %%pigeonCopyPage%% remaining this month. Get unlimited access and support reader-funded, independent data journalism.

Start a 14-day free trial now. Pay later!

Start Trial