Widget Image
Follow PPD Social Media
Friday, January 10, 2025
HomeStandard Blog Whole Post (Page 43)

“What Do They Know That We Don’t”?: Sunday Afternoon Rate Cut, Coordinated With Key Global Central Banks
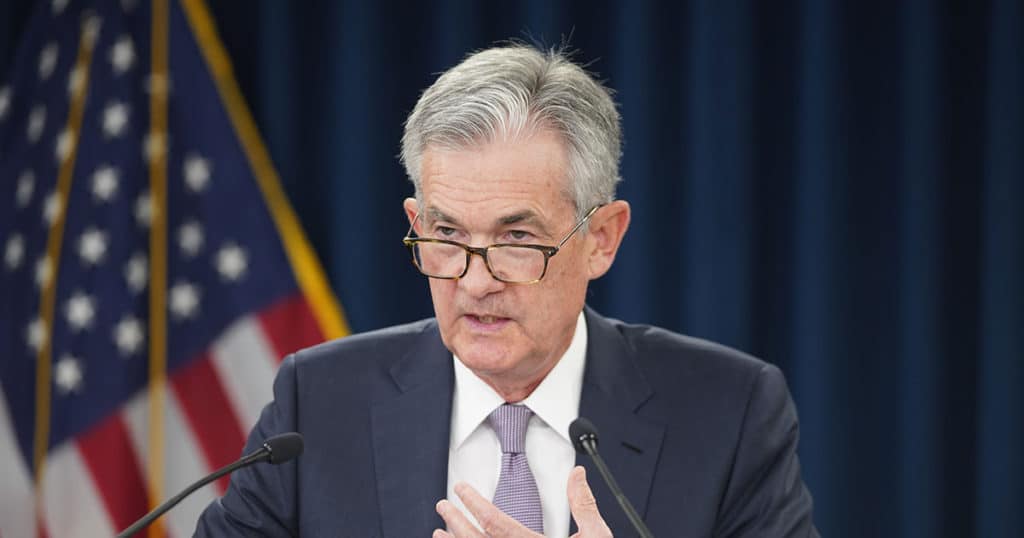
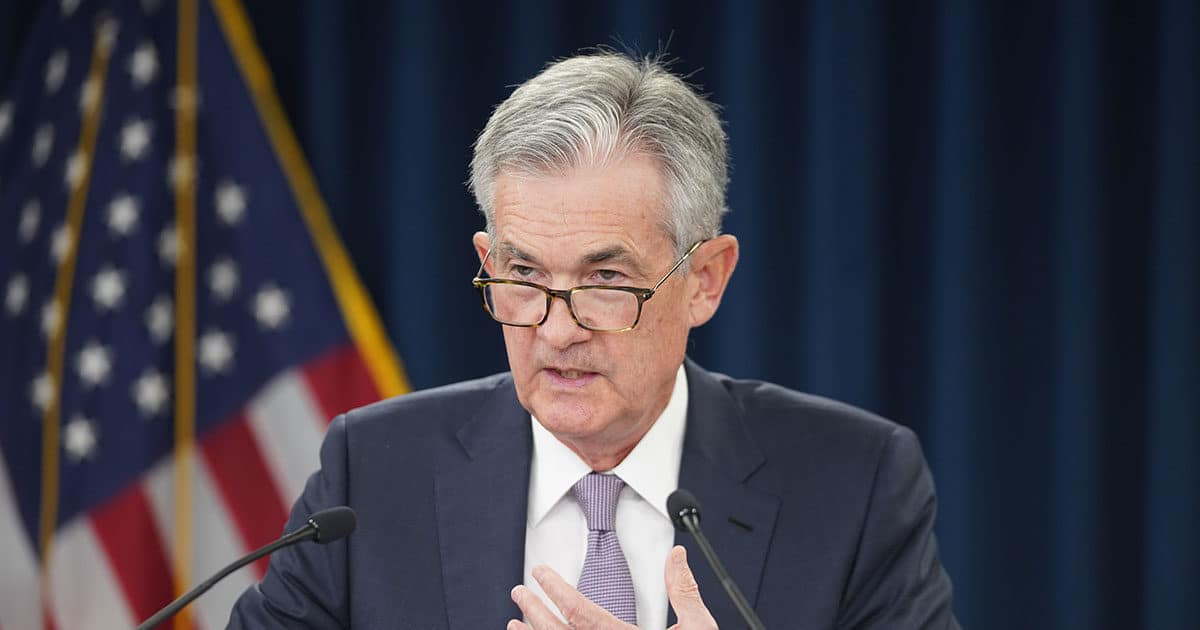
Federal Reserve Chair Jerome Powell answers questions at a press conference on September 18, 2019. (Photo: Courtesy of Federal Reserve)

New York, New York (PPD) — The Federal Reserve cut their base interest rate by a full 1.0% Sunday after moving up their policy meeting scheduled for March 17 and 18 to Sunday afternoon. The announcement was made only minutes before the White House daily briefing on the Coronavirus scheduled for 5:00 pm.

At 7:30 AM EST, stock index futures are pressed down the limit — 5% for off-hours trading — where they have been for most of the overnight session.

The closing levels from Thursday of S&P 500 (^SPX) at 2,351.10, the Dow Jones Industrial Average (^DJI) at 21,200, and Nasdaq Composite (^IXIC) at 7201.80, are the first meaningful technical support on any further weakness.

After the near +10% rally Friday, we’ve got more room before a test of those levels, even if we hit Level I circuit breakers after cash trading opens at 9:30 AM EST.

President Donald Trump, a frequent critic of FED chairman Powell, was clearly elated with the announcement.

“You will no longer hear me criticize the Fed or Chairman Jay Powell again,” he said as he kicked off the daily White House briefing.

While market participants and FED watchers have been expecting a 1.0% rate cut at the FEDs policy meeting this Wednesday, the late Sunday afternoon announcement clearly caught most wrong footed.

“On a Sunday?” was the response from quite a few seasoned market pros, many of whom followed up with, “This must be really bad.” Of course, they were referring to the economic impact from the Coronavirus. Many were so taken back by the rate move on a Sunday, just three days before their scheduled meeting, it left them speculating, “what do they know that we don’t”?

Global financial markets were not reassured by the FED decision.  At 11:00 pm Sunday, stock index futures were offered down the limit of -5% for off-hours trading. While it’s often hard to read the “stickiness” of overnight price action, some give back from the +~10% rally  Friday would not be alarming. There is little doubt that Monday is setting up as an action packed trading day with the potential for plenty of volatility.

It’s clear the FED wanted their rate cut decision out to global investors well before markets in Asia and Europe began trading Monday morning.  Europe is now the “hotspot” for the runaway virus and the concern is palpable that the European Central Bank has limited policy tools against any further economic weakness.  Their base interest rate is already below zero, and at their policy meeting last week they chose not to take it further into negative territory.

Despite the virus settling down quite a bit in China, the economic data is beginning to show the harsh reality of its impact on the Chinese economy.  Monday morning China reported that industrial output for the January to February period declined -13.5% on a YoY measure.

Retail sales took an even larger hit, down -20% YoY for the same January to February period. While these declines were many times the estimates in print, The Shanghai Composite was lower by less than -1% three hours into the trading day.

We’re entering a very critical week on multiple fronts. The FED has stepped up with a serious stand on the monetary policy front. Regardless, markets may remain on defense, absent decisive action on fiscal policy from lawmakers in Washington DC.

New York, New York (PPD) — The
The Survey of Consumers initial reading on consumer sentiment for March eased but remained resilient amid rising concerns over the spread of the coronavirus. The Sentiment Index fell from 101.0 in February to 95.9, though consumers remain optimistic about the overall future.

“Importantly, the initial response to the pandemic has not generated the type of economic panic among consumers that was present in the runup to the Great Recession,” Surveys of Consumers chief economist, Richard Curtin said. “Nonetheless, the data suggest that additional declines in confidence are still likely to occur as the spread of the virus continues to accelerate.”

“Perhaps the most important factor limiting consumers’ initial reactions is that the pandemic is widely regarded as a temporary event.”

A young woman consumer wearing a disposable medical mask while shopping at the supermarket during the Chinese Coronavirus (COVID-19) outbreak. (Photo: AdobeStock)

The Index of Consumer Expectations fell from 92.1 in February to 85.3 in March. But the Index of Current Economic Conditions only ticked down slightly from 114.8 to 112.5.

Of note, the component of the Sentiment Index that posted the largest decline was the outlook for the economy during the year ahead. This component declined 29 points, accounting for 83% of the total point decline in early March.

However, consumers more favorably judged the economic outlook over the next five years than last month.

Mr. Curtain noted the most effective containment efforts are widespread closures and self-isolation, which consequently have the most negative impact on the economy. They also significantly increase the probability that the pandemic will be followed by a recession that lasts longer than the virus, itself.

“The best policy antidote would be immediate relief provided by multiple sources of cash transfers and debt forbearance,” Mr. Curtain added. “To avoid a recession, speed is more essential than targeting.”

“Moreover, maintaining confidence in the effectiveness of economic policies is essential, otherwise the intended behavioral reactions on spending may not be forthcoming.”

The Survey of Consumers initial reading on

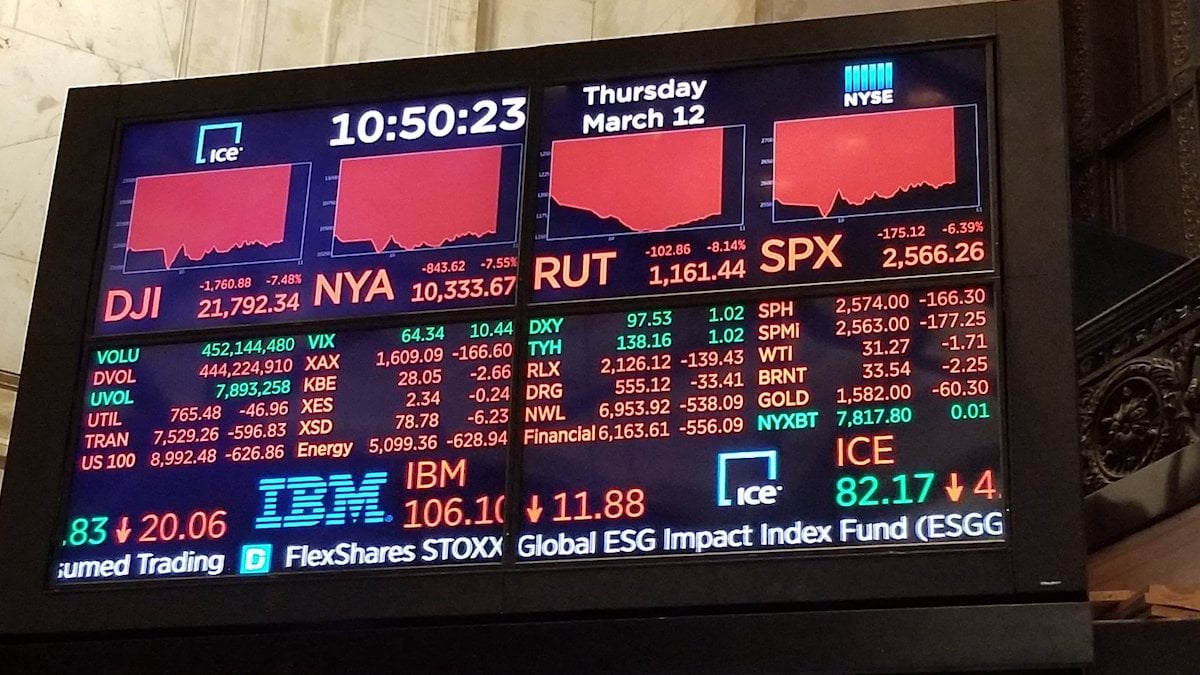
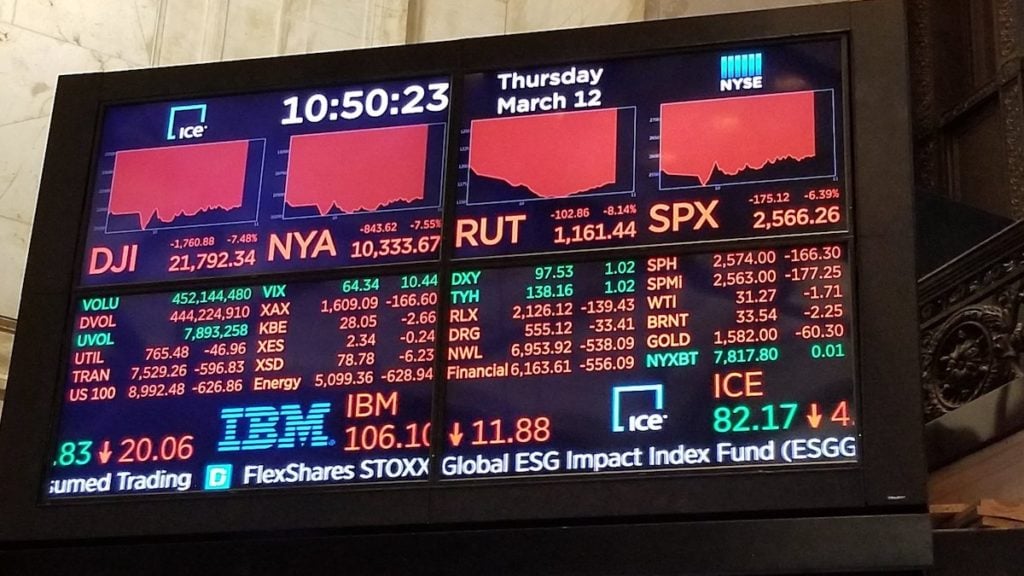
At the New York Stock Exchange (NYSE), a more than 7% decline of the Dow Jones Industrial Average triggers market-wide circuit breakers for the second time on the week on March 12 2020. (Photo: People's Pundit Daily)
At the New York Stock Exchange (NYSE), a more than 7% decline of the Dow Jones Industrial Average triggers market-wide circuit breakers for the second time on the week on March 12 2020. (Photo: People’s Pundit Daily)

On Thursday, declines to the major market indexes triggered market-wide circuit breakers that halted trading for the second time this week. The declines were due to oil price wars and growing fears surrounding the spread of the coronavirus (COVID-19).

Until this week, many were unfamiliar with these mechanisms. So, what are market-wide circuit breakers and what do they do?

Market-wide circuit breakers (MWCB) are important, automatic mechanisms invoked if markets experience extreme broad-based declines.

They are designed to slow the effects of extreme price movement through coordinated trading halts across securities markets when severe price declines reach levels that may exhaust market liquidity.

Market-wide circuit breakers may result in a temporary trading halt, or under extreme circumstances, close the markets before the normal close of the trading session.

  • They provide for trading halts in all equities and options markets during a severe market decline as measured by a single-day decline in the S&P 500 Index.
  • A market-wide trading halt can be triggered if the S&P 500 Index declines in price as compared to the prior day’s closing price of that index.  The triggers have been set by the markets at three circuit breaker thresholds—7% (Level 1), 13% (Level 2), and 20% (Level 3).
  • A market decline that triggers a Level 1 or Level 2 circuit breaker after 9:30 a.m. ET and before 3:25 p.m. ET will halt market-wide trading for 15 minutes, while a similar market decline at or after 3:25 p.m. ET will not halt market-wide trading.
  • A market decline that triggers a Level 3 circuit breaker, at any time during the trading day, will halt market-wide trading for the remainder of the trading day.

MWCB level thresholds for March 12, 2020 are as follows:

  • Level 1 = 2,549.48 (7%)
  • Level 2 = 2385.00 (13%)
  • Level 3 = 2193.10 (20%)

The Dow Jones Industrial Average (^DJI) was down −1,696.31, or 7.20% to 21,856.91.

Wall Street saw a halt to trading

The U.S. Labor Department (DOL) reported initial jobless claims came in at a seasonally adjusted 211,000 for the week ending March 7, easily beating the consensus forecast. That’s a decline of 4,000 from the previous week’s downwardly revised 215,000.

Forecasts ranged from a low of 215,000 to a high of 218,000. The consensus forecast was 216,000.

Lagging Claims Data

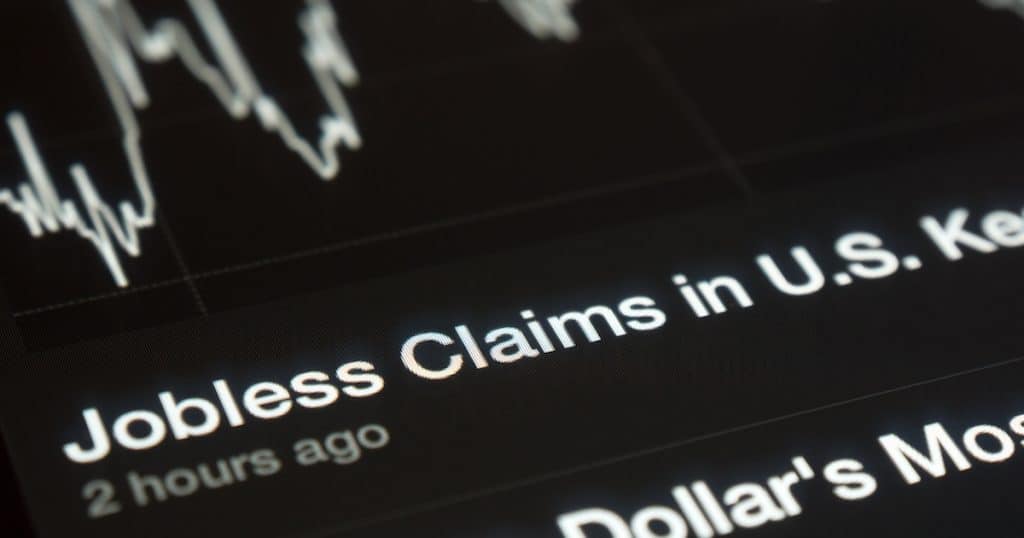
U.S. initial jobless claims graph on a tablet screen. (Photo: AdobeStock)

The advance seasonally adjusted ins

The advance number for seasonally adjusted insured unemployment during the week ending February 29 was 1,722,000, a decrease of 11,000 from the previous week’s revised level. The previous week’s level was revised up 4,000 from 1,729,000 to 1,733,000.

The 4-week moving average was 1,727,500, an increase of 5,250 from the previous week’s revised average. The previous week’s average was revised up by 1,000 from 1,721,250 to 1,722,250.ured unemployment rate was unchanged at a very low 1.2% for the week ending February 29.

No state was triggered “on” the Extended Benefits program during the week ending February 22.

State Jobless Claims Data

The highest insured unemployment rates in the week ending February 22 were in Alaska (2.9), New Jersey (2.8), Rhode Island (2.6), Connecticut (2.5), Montana (2.5), West Virginia (2.5), Massachusetts (2.3), Pennsylvania (2.3), Puerto Rico (2.3), Illinois (2.2), and Minnesota (2.2).

The largest increases in initial claims for the week ending February 29 were in New York (+17,064), California (+6,699), Ohio (+3,708), Virginia (+1,188), and Texas (+645), while the largest decreases were in Massachusetts (-4,399), Illinois (-2,832), North Carolina (-1,085), Rhode Island (-1,047), and Indiana (-703).

Initial jobless claims fell again to a

Market-Wide Circuit Breakers Tripped After 7.2% Decline

New York, N.Y. (PPD) — The Dow Jones Industrial Average (^DJI) dropped more than 7% on Thursday morning, triggering market-wide circuit breakers that halted trading for the second time this week.

The Dow was down −1,696.31, or 7.20% to 21,856.91.

Market-wide circuit breakers are important, automatic mechanisms invoked if markets experience extreme broad-based declines.

They are designed to slow the effects of extreme price movement through coordinated trading halts across securities markets when severe price declines reach levels that may exhaust market liquidity.

Market-wide circuit breakers may result in a temporary trading halt, or under extreme circumstances, close the markets before the normal close of the trading session.

Trading is expected to resume at around 9:50 AM EST.

•They provide for trading halts in all equities and options markets during a severe market decline as measured by a single-day decline in the S&P 500 Index.

•A market-wide trading halt can be triggered if the S&P 500 Index declines in price as compared to the prior day’s closing price of that index.  The triggers have been set by the markets at three circuit breaker thresholds—7% (Level 1), 13% (Level 2), and 20% (Level 3).

•A market decline that triggers a Level 1 or Level 2 circuit breaker after 9:30 a.m. ET and before 3:25 p.m. ET will halt market-wide trading for 15 minutes, while a similar market decline at or after 3:25 p.m. ET will not halt market-wide trading.

•A market decline that triggers a Level 3 circuit breaker, at any time during the trading day, will halt market-wide trading for the remainder of the trading day.

The Dow Jones Industrial Average (^DJI) dropped

President Trump Announces Bold Public Health and Economic Measures Amid Growing Coronavirus Concerns

President Donald Trump announced late Wednesday in an Oval Office address to the nation that the United States (U.S.) will impose a 30-day travel ban for Europe. The president addressed the nation amid growing concerns over the spread of the coronavirus, or COVID-19.

“Each of us has a role to play in defeating this virus.”

“I will always put the welfare and well-being of Americans first,” the president added. “No nation is more prepared to deal with this. We have the best economy, the most advanced healthcare and the most talented doctors in the world.”

On Wednesday, the World Health Organization (WHO) officially declared the coronavirus a global pandemic.

Homeland Security Acting Secretary Secretary Chad F. Wolf the actions taken by President Trump “will keep Americans safe and save American lives.”

“I applaud the president for making this tough but necessary decision,” he said in a statement following the address. “While these new travel restrictions will be disruptive to some travelers, this decisive action is needed to protect the American public from further exposure to the potentially deadly coronavirus.”

President Trump announced the U.S. will impose

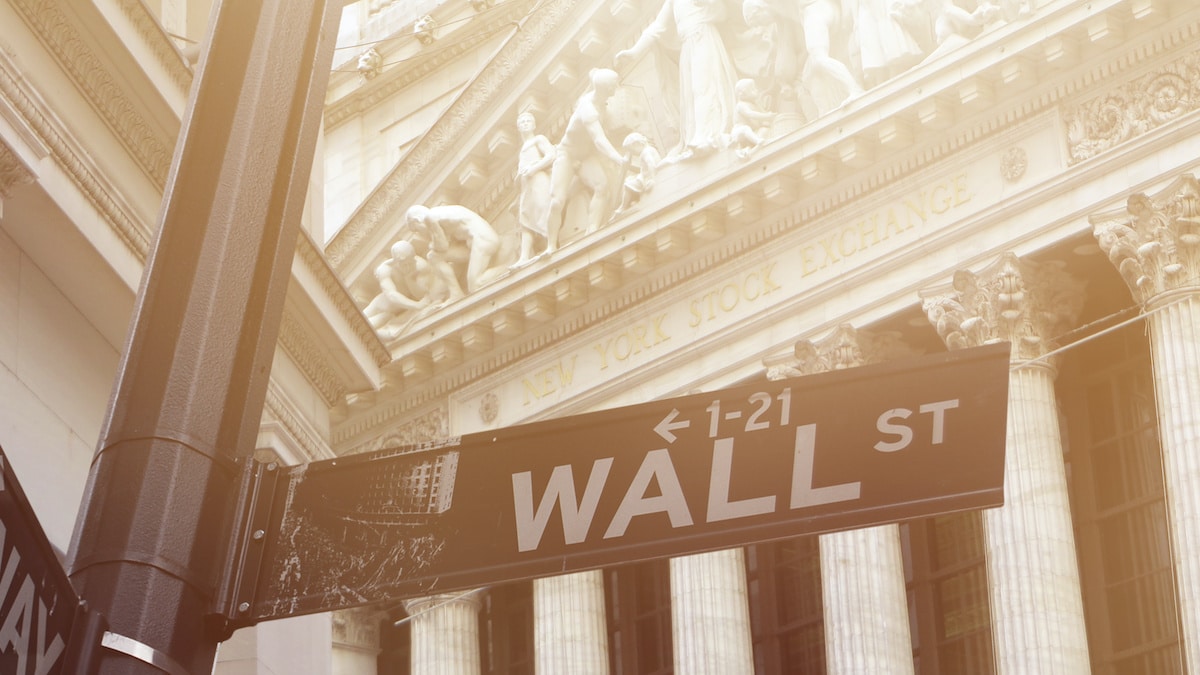
Wall Street at the New York Stock Exchange (NYSE), the world's largest stock exchange by market capitalization of listed companies. (Photo: AdobeStock)
Wall Street at the New York Stock Exchange (NYSE), the world’s largest stock exchange by market capitalization of listed companies. (Photo: AdobeStock)

We do not believe that prior market events and dynamics repeat themselves in a predictive manner. Every market event and phase has its own characteristics, or fingerprint, if you will.

That being said, there is much to learn from the history of market behavior, just avoid expecting past market events to repeat themself.

The sharp stock market selloff that began the last week of February shares many similarities to the market correction during the fourth quarter (Q4) of 2018.

Sure, the current selloff has taken place in a very compressed time frame. There are different fundamental issues as a backdrop today than there were in 2018. But the percentage declines are eerily similar, with the caveat there is no assurance this correction has run its course.

Current Market Correction:  February 24 – March 9

The Dow Jones Industrial Average (^DJI) peaked on February 12 at 29551.42. On March 9, 17 trading days later, it closed at 23851.02, a decline of -19.3%.

The S&P 500 (^SPX) closed at an all time high of 3386.15 on February 19, having closed at a new high 4 of the last 6 trading days. On March 9, 13 trading days later, the S&P 500 closed at 2746.56, a decline of -18.9%.

The NASDAQ Composite (^IXIC) peaked at 9817.18 on February 19, having closed at a new high 6 of the last 7 trading days. On March 9, 13 trading days later, the NASDAQ closed at 7950.68, a decline of -19%.

The closeness of the declines among the Major Market Averages is striking. During an incredibly volatile 2½ weeks the declines of the major averages range from -18.9% to -19.3%.

It is also striking that all three market averages have declined fractionally less than -20%.  A twenty percent decline is typically referenced as the threshold below which market watchers consider that a bear market is in effect.

Now let’s contrast the current correction with what we experienced during Q4 2018.

Early in the fourth quarter of 2018 the three Major Market Averages reached fresh all time highs on, or close to October 3rd. This break out to new highs did not hold, and within a few days market averages began a sharp correction that would last well over two months, climaxing with the December 24 lows.

Fourth Quarter (Q4) 2018: Early October – December 24

The DJIA sold off during Q4 2018 from an all time high of 26828.39 on October 3 to 21792.20 on December 24, a decline of -18.8%.

The S&P 500 peaked at 2930.75 on September 20. Over the next 3 months the S&P 500 declined -19.8% before bottoming out at 2351.10 on December 24. 

The NASDAQ composite posted an all time high at 8109.54 on the last day of August and was at nearly the same level at the beginning of October. On December 24 the NASDAQ closed at 6192.92 a decline of -23.6%

It’s worth noting that during Q4 2018 the NASDAQ composite was the only Major Market Average that exceeded the false litmus test of a 20% decline signalling a bear market.  The NASDAQ only passed the -20% “bear market” threshold during the last 2 days of the correction and rallied out of “bear market” territory within a couple days after the correction had ended.

Again, we’re not saying yet that the current correction is over, or that a post correction rally will replicate the rally after the correction from Q4 2018.  Simply that the current selloff, coming shortly after market averages were at all time highs and showing very similar percentage declines make Q4 2018 a compelling frame of reference for the current selloff.

The sharp stock market selloff that began

Stock Markets Rebound After Dow Drops 2k Points on Oil Fears

New York, N.Y. (PPD) — The Dow Jones Industrial Average (^DJI) rallied +1,164.12 points, or 4.88% on Tuesday to 25,015.14, after the index fell 2,000 points on Monday.

The S&P 500 (^SPX) also closed up, rallying +135.67 or 4.94% to 2,882.23.

The Nasdaq Composite (^IXIC) closed up +393.58, or 4.95% 8,344.25.

On Monday, the major market indexes were not only reacting to growing coronavirus fears, but more predominantly to the “mother of all price wars” between Saudi Arabia and Russia.

Oil prices plunged to their lowest levels in nearly four years following steep wholesale price cuts announced by Saudi Aramco, the state owned oil company. It was a direct response to Russia backing away from an agreement on managed production cuts among members of OPEC (Organization of the Petroleum Exporting Countries).

Although not an OPEC member, Russia is a large producer and exporter of crude and has frequently attended OPEC meetings as a non-member, particularly when coordination is sought on production schedules.

The Dow Jones Industrial Average (^DJI) rallied

Historically High Level for Small Business Owners Planning to Increase Employee Compensation

WASHINGTON, D.C. (PPD) — Small business optimism inched higher by 0.2 points to 104.5 in February, according to the NFIB Optimism Index. That reading — easily beating the consensus forecast — is among the top 10 percent in the 46-year history of the survey.

Four of the 10 Index components improved and 6 declined, while the Uncertainty Index fell 1 point in February to 80. Almost all of February’s survey responses were collected prior to the escalation of the coronavirus outbreak and the half point cut by the Federal Reserve.

“The small business economic expansion continued its historic run in February, as owners remained focused on growing their businesses in this supportive tax and regulatory environment,” said NFIB Chief Economist William Dunkelberg. “February was another historically strong month for the small business economy, but it’s worth noting that nearly all of the survey’s responses were collected prior to the recent escalation of the coronavirus outbreak and the Federal Reserve rate cut. Business is good, but the coronavirus outbreak remains the big unknown.”

Reports of better business conditions in the next six months jumped 8 points to a net 22%. Job openings rose 1 point to 38%, only 1 point below the all-time high reading last reached in July 2019.

Job creation remained high in February. Small businesses continued to hire and create new jobs, while the net percent raising compensation was unchanged at 36%, only 1 point below the record high.

Worth noting, the monthly employment report confirmed the rise in job creation for the month and the increased upward pressure on wages that have now risen at or above 3% for 19 straight months.

“Firms will likely continue offering improved compensation to attract and retain qualified workers as the labor market remains highly competitive,” said Dunkelberg. “Compensation levels will hold firm unless the economy weakens substantially as owners do not want to lose the workers that they already have.”

Small business optimism inched even higher than

New York, N.Y. (PPD) — Dow Jones Industrial Average (^DJI) futures are up roughly 1,000 points ahead of the opening bell on Tuesday after the index fell 2,000 points on Monday.

The major market indexes were not so much reacting to growing coronavirus fears, but more predominantly to the “mother of all price wars” between Saudi Arabia and Russia.

The Dow essentially opened down −1,884.88, or 7.29% to 23,979.90 on Monday, triggering market-wide circuit breakers that halted trading for 15 minutes. But the circuit breakers did their job, found a buying market and stopped the bleeding.

Oil prices plunged to their lowest levels in nearly four years after steep wholesale price cuts announced by Saudi Aramco, the state owned oil company. It was a direct response to Russia backing away from an agreement on managed production cuts among members of OPEC (Organization of the Petroleum Exporting Countries).

Although not an OPEC member, Russia is a large producer and exporter of crude and has frequently attended OPEC meetings as a non-member, particularly when coordination is sought on production schedules.

New York, N.Y. (PPD) — Dow Jones

People's Pundit Daily
You have %%pigeonMeterAvailable%% free %%pigeonCopyPage%% remaining this month. Get unlimited access and support reader-funded, independent data journalism.

Start a 14-day free trial now. Pay later!

Start Trial