Widget Image
Follow PPD Social Media
Friday, January 10, 2025
HomeStandard Blog Whole Post (Page 44)

What Are Market-Wide Circuit Breakers? Find Out Below

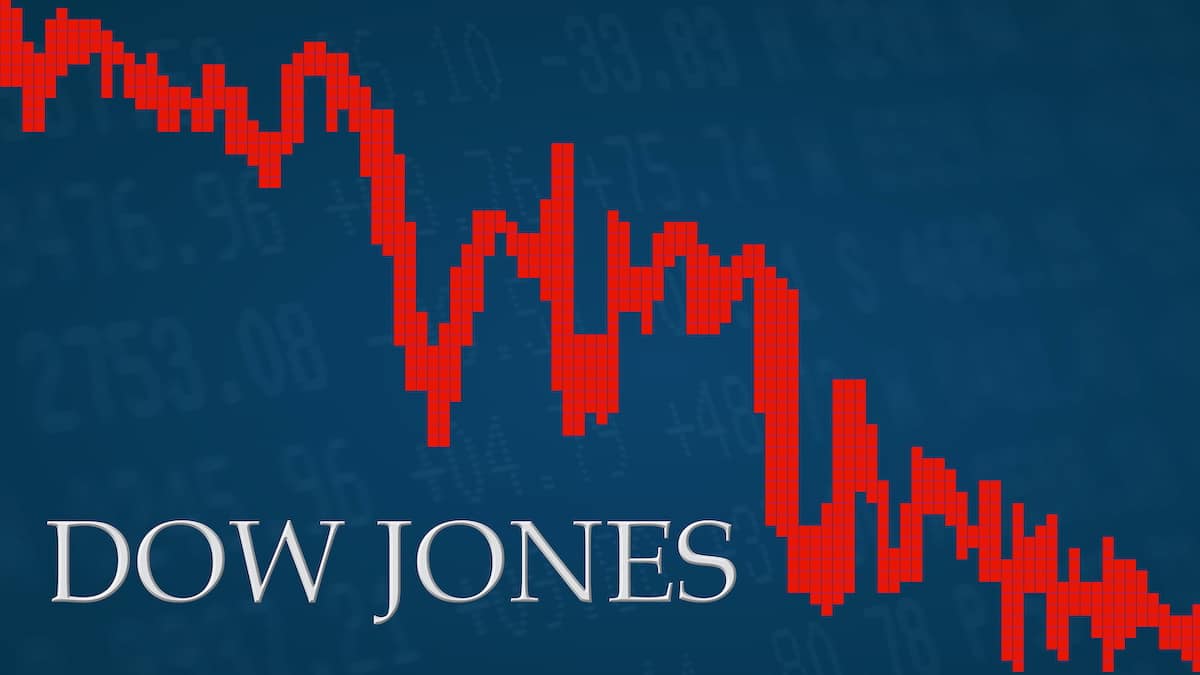
New York, N.Y. (PPD) — The Dow Jones Industrial Average (^DJI) dropped more than 7% after the opening bell on Monday, triggering market-wide circuit breakers that halt trading. The Dow was down −1,884.88, or 7.29% to 23,979.90.

UPDATE 10:02 AM EST: The market-wide circuit breakers are working and the markets have come off their sessions lows, though the Dow Jones remains down slightly more than 6%.

ORIGINAL STORY CONTINUED BELOW

The major market indexes are not only reacting to growing coronavirus fears, but more predominantly to the “mother of all price wars” between Saudi Arabia and Russia.

Oil prices have plunged to their lowest levels in nearly four years following steep wholesale price cuts announced by Saudi Aramco, the state owned oil company. It was a direct response to Russia backing away from an agreement on managed production cuts among members of OPEC (Organization of the Petroleum Exporting Countries).

Although not an OPEC member, Russia is a large producer and exporter of crude and has frequently attended OPEC meetings as a non-member, particularly when coordination is sought on production schedules.

The S&P 500 (^SPX) was down −214.96, or 7.23% to 2,757.41.

Graphic concept of the Dow Jones Industrial Average (^DJI) trading down in the red for losses. (Photo: AdobeStock)

MWCB Level Thresholds for March 9, 2020:

  • Level 1 = 2,764.30 (7%)
  • Level 2 = 2,585.96 (13%)
  • Level 3 = 2,377.89 (20%)

Market-wide circuit breakers are important, automatic mechanisms invoked if markets experience extreme broad-based declines. They are designed to slow the effects of extreme price movement through coordinated trading halts across securities markets when severe price declines reach levels that may exhaust market liquidity.

Market-wide circuit breakers may result in a temporary trading halt, or under extreme circumstances, close the markets before the normal close of the trading session.

•They provide for trading halts in all equities and options markets during a severe market decline as measured by a single-day decline in the S&P 500 Index.

•A market-wide trading halt can be triggered if the S&P 500 Index declines in price as compared to the prior day’s closing price of that index.  The triggers have been set by the markets at three circuit breaker thresholds—7% (Level 1), 13% (Level 2), and 20% (Level 3).

•A market decline that triggers a Level 1 or Level 2 circuit breaker after 9:30 a.m. ET and before 3:25 p.m. ET will halt market-wide trading for 15 minutes, while a similar market decline at or after 3:25 p.m. ET will not halt market-wide trading.

•A market decline that triggers a Level 3 circuit breaker, at any time during the trading day, will halt market-wide trading for the remainder of the trading day.

The Dow Jones Industrial Average (^DJI) dropped
Saudis Retaliate After Russia Refuses Production Cuts Last Week

The price of WTI Crude oil is falling. A red zig-zag arrow with an oil well pumpjack behind the word WTI on a blue background shows downwards, symbolizing a price fall or drop of the commodity.
The price of WTI Crude oil is falling. A red zig-zag arrow with an oil well pumpjack behind the word WTI on a blue background shows downwards, symbolizing a price fall or drop of the commodity. (Photo: AdobeStock)

The Mother of all Price Wars

New York, N.Y. (PPD) — Oil prices have plunged to their lowest levels in nearly four years following steep wholesale price cuts announced by Saudi Aramco, the state owned oil company. Every indication is that these price cuts are a direct response to Russia backing away from an agreement on managed production cuts among members of OPEC (Organization of the Petroleum Exporting Countries).

Although not an OPEC member, Russia is a large producer and exporter of crude and has frequently attended OPEC meetings as a non-member, particularly when coordination is sought on production schedules.

The Saudis had essentially negotiated a production cut among OPEC members to stabilize the price of oil in the aftermath of the Coronavirus. Oil prices have been sliding for weeks as global demand has receded.

In February, industrial output in China dropped precipitously as factories were shuttered and travel curtailed following large scale quarantines.  

To make production cuts effective, the Saudis wanted Russia to join OPEC in its attempt to stabilize the falling price of crude. In an attempted power play, as a large oil producer and exporter, Russia declined. Putting it mildly, the Saudis were not happy.

“Russia has wildly overplayed their hand” according to Justin Flinn, a Managing Director with TJM Investments in New York, and an expert in the geopolitical workings of global oil markets. “All of a sudden Russia is the leading player in the OPEC community? The Saudis said, ‘Not so fast my friend.'”

On Saturday, Saudi Aramco notified wholesale buyers it was slashing prices by $6 to the Far East, $7 to the U.S. and $8 to Northern Europe for delivery beginning in April. Notice the steepest cuts of $8 to Northern Europe are the closest to Russia.

These price cuts have had an immediate and drastic impact on oil prices, as futures trading began Sunday evening. Brent Crude (CO), the global benchmark fell 20% to $36.00 on the heels of an 8% decline Friday after word began to circulate that Russia had nixed the deal on production quotas.

Updating at 11:30 pm in New York;  Oil future prices have traded relentlessly lower over the last five hours. Both Nymex and Brent Crude are now lower by between -28% and -30% with Brent encroaching on $32.00 and the Nymex contract between $28.00 and $28.50.

“Saudi Arabia has turned on a dime and will now play a market share game,” Flinn said.  They have the lowest cost of production on the planet and they’ve done this before in less dramatic fashion.  In 2014 a sharp decline in the price of oil was a major hit to the burgeoning fracking and shale business of U.S. producers.

Today, while the fracking and shale producers in the U.S. are much more efficient with  a lower break/even threshold that in 2015, they will no doubt feel a pinch.

“It always used to be the case where low oil prices were great for the U.S. consumer and that was a positive that rippled through our economy,” Flinn added, elaborating on the tradeoff. “Today we have a huge oil and gas industry and have recently become a net exporter.

“There’s a price for oil on the way down where it’s a net negative with millions of jobs on the line. High paying jobs with trickle down effects.’’

Oil prices have plunged to their lowest

Energy Independence Fueling Narrowing Trade Deficit

The U.S. trade deficit for goods and services narrowed to $45.3 billion in January, down another $3.3 billion from a downwardly revised $48.6 billion in December. The first trade balance report for 2020 beat the forecast after 2019 posted the first annual decline since 2013.

Forecasts ranged from a low of $-53.6 billion to a high of $-45.5 billion. The consensus forecast was $-46.1 billion.

Import, Export, Logistics concept - Map global partner connection of Container Cargo freight ship for Logistic Import Export background (Photo: AdobeStock/Elements of this image furnished by NASA)
Import, Export, Logistics concept – Map global partner connection of Container Cargo freight ship for Logistic Import Export background (Photo: AdobeStock/Elements of this image furnished by NASA)

Exports, Imports, and Balance

The U.S. Census Bureau and the U.S. Bureau of Economic Analysis announced Friday exports in January fell far less than imports. Exports came in at $208.6 billion, a decline of $0.9 billion. Imports were $253.9 billion, a decline of $4.2 billion.

The decrease in the overall goods and services deficit reflected a decline in the goods deficit of $2.6 billion to $67.0 billion and an increase in the services surplus of $0.6 billion to $21.7 billion.

The goods and services deficit has fallen $8.5 billion, or 15.8%, from January 2019. Exports have gained $2.3 billion, or 1.1%. Imports have declined $6.2 billion, or 2.4%.

Three‐Month Moving Averages

The three-month average goods and services deficit decreased $0.7 billion to $45.9 billion for the period ending January 2020. Average exports rose $0.7 billion to $208.6 billion, while average imports fell less than $0.1 billion to $254.5 billion.

Year‐over‐year, the three-month average goods and services deficit ending in January 2019 fell $10.2 billion. Average exports rose $1.9 billion and average imports fell $8.2 billion.

U.S.-China Trade Deficits

The politically-sensitive trade deficit with China fell $7.9 billion to $69.4 billion in the fourth quarter (Q4) 2019. While exports fell $4.1 billion to $38.0 billion, imports fell $12.0 billion to $107.5 billion.

The trade in goods deficit with China fell $2.1 billion to $23.7 billion in January. Exports rose $0.2 billion to $7.7 billion and imports fell $1.8 billion to $31.4 billion.

Trade Balance By Nation

Trade Surpluses

The Q4 2019 figures show surpluses, in billions of dollars, with South and Central America ($20.5), Brazil ($8.7), OPEC ($7.8), Hong Kong ($6.4), United Kingdom ($5.5), Singapore ($4.8), and Saudi Arabia ($3.6). Deficits were recorded, in billions of dollars, with China ($69.4), European Union ($26.9), Mexico ($25.5), Germany ($14.8), Japan ($11.3), Italy ($9.0), India ($6.7), Taiwan ($5.0), Canada ($3.9), France ($2.9), and South Korea ($1.6).

Trade Deficits

The U.S.-European Union trade deficit decreased $8.1 billion to $26.9 billion in Q4 2019. Exports rose $1.9 billion to $152.7 billion and imports declined $6.2 billion to $179.6 billion.

The U.S.-Canada trade deficit rose $1.9 billion to $3.9 billion in Q4 2019. Exports fell $1.6 billion to $88.2 billion, while imports rose $0.3 billion to $92.1 billion.

Energy Independence and the Narrowing Trade Deficit

As People’s Pundit Daily (PPD) previously reported, the U.S. trade deficit for goods and services declined 1.7% to $616.8 billion in 2019. It is the first annual decrease since 2013.

According to new annual data from the U.S. Census Bureau, the deficit decline in the international trade balance was driven by energy independence.

Crude oil exports soared 35.5% or $17.1 billion compared to the same period in 2018, while crude oil imports cratered 19.3% or $30.3 billion over the prior year.

More Trade News

The U.S. trade deficit for goods and

Wage Growth Stronger for Workers than for Managers

Business and economy concept showing people climbing up the economic ladder for success, for the better income, wages and salaries, pay raises, etc. (Photo: AdobeStock)

Wages, or average hourly earnings (AHE) for all employees on private nonfarm payrolls, increased by 3.0% over the last 12 months in February. It marks 19 consecutive months in which wages grew at or above 3%, according to the U.S. Bureau of Labor Statistics (BLS) monthly jobs report.

Average hourly earnings of private-sector production and nonsupervisory employees increased by 8 cents to $23.96 in February, while private nonfarm payrolls increased by 9 cents to $28.52.

“The blue collar boom continued in February with private sector wages growing 3% year-over-year, and production and non-supervisory workers’ wages increased even faster than managers’,” U.S. Secretary of Labor Eugene Scalia, said in a statement.

Forecasts for 12-month wage growth ranged from a low of 2.9% to a high of 3.2%. The consensus forecast was 3.0%.

In December, 12-month wage growth was initially reported at 2.9%, but the reporting period cut off and underestimated the rate of growth. It was revised higher to 3.0%.

Total nonfarm payrolls rose 237,000 in February and the unemployment rate ticked down to 3.5%. With revisions, job gains for the two months of the year combined were 85,000 higher than initially reported.

It also marks the strongest two-month start to the year for job creation under the Trump Administration.

“The Department of Labor continues to implement the President’s policies that are helping workers and their families thrive, including closing the skills gap through apprenticeships, and bringing more Americans off the sidelines for good, safe, family-sustaining careers,” Secretary Scalia added.

“The signing of USMCA and Phase I of the China Agreement establish sound footing to continue economic expansion this year and beyond.”

In the fourth quarter (Q4) 2018, wages posted the biggest gain (3.1%) since Q3 2008, a critical threshold indicating a healthy labor market for the first time since the Great Recession. As People’s Pundit Daily (PPD) previously reported, annual revisions to data also indicate wage growth in 2019 was likely stronger than we currently believe.

The U.S. Bureau of Economic Analysis (BEA) revealed wages grew even stronger than initially reported in 2017 and 2018, the first two years under the Trump Administration.

Meanwhile, the far more moderate gains reported for the tenure under Barack Obama, were revised further down.

You Might Also Like

In February, wages, or average hourly earnings

Job Growth Revised Higher for Prior Two Months, Strongest Year Start Under Trump Administration

Total nonfarm payrolls rose 237,000 in February and the unemployment rate ticked down to 3.5%, according to the U.S. Bureau of Labor Statistics (BLS) monthly jobs report. The Employment Situation is the latest indicator the labor market is weathering the coronavirus.

The headline jobs number exceeded the high end of the forecast range. Forecasts ranged from a low of 149,000 to a high of 220,000. The consensus forecast was 177,000.

“The February jobs numbers easily beating expectations should have been one of the most predictable beats in years,” Tim Anderson, analyst at TJM Investments on the New York Stock Exchange (NYSE). “Non farm payrolls increasing by these numbers should not be that big of a surprise.”

“In February, we had three consecutive reports of weekly jobless claims at 210,000 or lower, the best 3-week stretch on record.”

The change in total nonfarm payroll employment for December was revised higher by 37,000 from +147,000 to +184,000. The change for January — which was already a big number — was revised higher by 48,000 from +225,000 to +273,000.

With these revisions, job gains for the two months combined were 85,000 higher than initially reported. It also marks the strongest two-month start to the year for job creation under the Trump Administration.

“The Department of Labor continues to implement the President’s policies that are helping workers and their families thrive, including closing the skills gap through apprenticeships, and bringing more Americans off the sidelines for good, safe, family-sustaining careers,” U.S. Secretary of Labor Eugene Scalia, said in a statement.

“The signing of USMCA and Phase I of the China Agreement establish sound footing to continue economic expansion this year and beyond.”

Labor Force Participation

The labor force participation rate remained at 63.4%, a very positive sign for the labor market. The employment-population ratio edged 0.1% lower to 61.1%, but is up by 0.5% over the year.

Forecasts ranged from a low of 63.3% to a high of 63.5%. The consensus forecast was 63.4%.

Most notably, labor force participation rates for Hispanic and African American workers continued to rise in February, by 0.3% and 0.7%, respectively.

Total Nonfarm Private Payrolls

Total nonfarm private payrolls increased by 228,000, also crushing the forecast. That’s the second straight month forecasts for private payrolls have been significantly beaten.

Forecasts ranged from a low of 140,000 to a high of 170,000. The consensus forecast was only 155,000, a still solid number.

Worth noting, the ADP National Employment Report released earlier this week found the U.S. economy added 183 private sector jobs in February after adding 291,000 in January. Both numbers beat the forecasts.

Construction added a solid 42,000 jobs in February, following a similar gain in January (+49,000). In 2019, increases in construction jobs averaged 13,000 per month, but now reflect surges in construction spending and builder confidence.

In February, employment gains occurred in specialty trade contractors (+26,000) and residential building (+10,000).

Wages

Wages, or average hourly earnings (AHE) for all employees on private nonfarm payrolls, increased by 3.0% over the last 12 months in February.

Wages have risen by at least 3% for 19 consecutive months.

Forecasts for wages ranged from a low of 2.9% to a high of 3.2%. The consensus forecast was 3.0%.

Average hourly earnings of private-sector production and nonsupervisory employees increased by 8 cents to $23.96 in February. 

AHEs for all employees rose by 8 cents to $23.96, while private nonfarm payrolls increased by 9 cents to $28.52.

“While this is an A+ jobs report by any measure, it will be overshadowed by the rampant fear and panic over the Coronavirus,” Mr. Anderson added. “That panic is causing at least 10 times more damage to financial markets that the virus, itself.”

You Might Also Like

Total nonfarm payrolls rose 237,000 in February

Warren Endorsement Looms Large Over Democratic Nomination

Elizabeth Warren snubs Bernie Sanders after the debate. (Photo: Screenshot)

Senator Elizabeth Warren, D-Mass., once the front-runner for the Democratic nomination, dropped out after failing to carry her own state on Super Tuesday. The candidate alerted staffers to the decision on a conference call on Thursday.

The question now remains whether Senator Warren — who shared the progressive lane with Senator Bernie Sander — will endorse.

However, even if the endorsement goes to Sanders, it might now be too late for the socialist senator to coalesce the leftwing.

Former Vice President Joe Biden swept the South and won a total 10 states on Super Tuesday, mounting a make-or-break comeback in Texas. It was fueled by a party establishment consolidating behind his candidacy in an effort to stop Senator Sanders.

In a crushing and embarrassing defeat, Senator Warren lost her own home state. The third place finish with 21% of the vote denied Sanders a much-needed win.

Biden ended up carrying the state, 33% to 27%.

It was far from the only state in which Senator Warren played the role of spoiler to Senator Sanders. The vote differential made all the difference in including Texas, Oklahoma, and Maine.

President Donald Trump, who called Senator Warren “selfish” on Wednesday, commented about the news on Twitter. He posted that she “probably cost him [Bernie] the nomination.”

“Elizabeth ‘Pocahontas’ Warren, who was going nowhere except into Mini Mike’s head, just dropped out of the Democrat Primary…THREE DAYS TOO LATE,” he tweeted. “She cost Crazy Bernie, at least, Massachusetts, Minnesota and Texas. Probably cost him the nomination! Came in third in Mass.”

Elizabeth Warren, D-Mass., once the front-runner for

Coronavirus Concerns Not Fueling Job Cuts

Closeup view of a business man cutting a piece of paper with the word jobs written on it, concept for job cut reports. (Photo: AdobeStock)

Job cuts announced by U.S.-based employers fell 16.4% in February from 67,735 to 56,660, according to the report by Challenger, Gray & Christmas, Inc. That’s down 26.3% from the 76,835 job cuts announced during February 2019.

“The Tech sector is undergoing immense change, as large companies make cuts to become more efficient,” said Andrew Challenger, Vice President of Challenger, Gray & Christmas, Inc. “Meanwhile, recent start-ups are folding or pivoting to more lucrative avenues or cutting back in order to comply with government regulations.”

That’s down 7.5% from the 41,977 cuts announced in the June Challenger Job Cuts Report.

While retail announced the second-highest number of cuts at 8,096, bringing the two-month total to 18,540, it is still 55% lower than the 41,201 cuts announced through the same period last year.

The Media announced another 1,584 cuts in February, the highest monthly total since 3,365 job cuts in March 2019. Of those, 386 were in the news media.

“Despite widespread concerns about COVID-19, it has yet to impact job cut announcements,” ,” said Challenger. “This may change if the supply side remains dormant, as companies grapple with whether to keep operations open without product.”

Coronavirus Concerns Not Fueling Job Cuts Closeup view

The U.S. Labor Department (DOL) reported initial jobless claims came in at a seasonally adjusted 213,000 for the week ending February 29, slightly missing the consensus forecast. That’s still a decline of 3,000 from the previous week’s unrevised 216,000.

Forecasts ranged from a low of 212,000 to a high of 226,000. The consensus forecast was 215,000.

The 4-week moving average was only 213,000, an increase of 3,250 from the previous week’s unrevised average of 209,750.

Lagging Jobless Claims Data

U.S. initial jobless claims graph on a tablet screen. (Photo: AdobeStock)

The advance seasonally adjusted insured unemployment rate was unchanged at a very low 1.2% for the week ending February 22.

The advance number for seasonally adjusted insured unemployment during the week ending February 8 was 1,729,000, an increase of 7,000. The previous week’s level was revised down by 2,000 from 1,724,000 to 1,722,000.

No state was triggered “on” the Extended Benefits program during the week ending February 15.

State Jobless Claims Data

The highest insured unemployment rates in the week ending February 15 were in Alaska (2.9), New Jersey (2.7), West Virginia (2.6), Connecticut (2.5), Montana (2.5), Pennsylvania (2.5), Puerto Rico (2.4), Rhode Island (2.4), Illinois (2.2), Massachusetts (2.2), and Minnesota (2.2).

The largest increases in initial claims for the week ending February 22 were in Massachusetts (+3,871), Illinois (+3,767), Rhode Island (+925), Indiana (+423), and Iowa (+392), while the largest decreases were in California (-8,466), Georgia (-1,247), Pennsylvania (-952), Oregon (-770), and Texas (-743).

Initial jobless claims came in at a

Chief Justice John Roberts presides over the impeachment trial of President Donald J. Trump. (Photo: Screenshot)

U.S. Supreme Court (SCOTUS) Chief Justice John Roberts issued a rare rebuke of “inappropriate” and “dangerous” threats made by Senate Minority Leader Chuck Schumer, D-N.Y., on Wednesday.

The threatening remarks were made outside the High Court on Wednesday and were directed at Justice Brett Kavanaugh and Justice Neil Gorsuch. Senator Schumer was attending a pro-abortionist protest during oral arguments for June Medical Services LLC v. Russo.

“I want to tell you Justice Kavanaugh and Justice Gorsuch: You have unleashed a whirlwind, and you will pay the price,” Senator Schumer said outside the High Court. “You will not know what hit you if you go forward with these decisions.”

The case surrounds the constitutionality of a 2014 law known as the Louisiana Unsafe Abortion Protection Act. It requires doctors who perform abortions in Louisiana to have the right to admit patients to a hospital within 30 miles of the place where the abortion is performed.

“Justices know that criticism comes with the territory, but threatening statements of this sort from the highest levels of government are not only inappropriate, they are dangerous,” Chief Justice Roberts said in the statement.

SCOTUSblog claimed the Court’s decision in the case is “likely to hinge on the vote of Chief Justice John Roberts or perhaps Kennedy’s successor, Justice Brett Kavanaugh.”

In response to widespread criticism, Senator Schumer’s office strangely denied saying what critics claim and attacked the court, again. A spokesman said Chief Justice Roberts “does not just call balls and strikes.”

“It’s a reference to the political price Republicans will pay for putting them on the court and a warning that the justices will unleash a major grass-roots movement on the issue of reproductive rights against the decision,” Schumer spokesman Justin Goodman said Wednesday.

“For Justice Roberts to follow the right wing’s deliberate misinterpretation of what Sen. Schumer said, while remaining silent when President Trump attacked Justices [Sonia] Sotomayor & [Ruth Bader] Ginsburg last week, shows Justice Roberts does not just call balls and strikes.”

Chief Justice John Roberts issued a rare

ISM Non-Manufacturing Index (NMI) Beats Consensus Forecast at 57.3

The Institute for Supply Management (ISM) Non-Manufacturing Index (NMI) indicates the U.S. service sector grew at a faster pace in February. The NMI came in at 57.3%, an increase of 1.8 percentage points from the seasonally adjusted reading of 55.5% in January.

Forecasts for the NMI ranged from a low of 52.9 to a high of 56.0. The consensus forecast was 55.

The New Orders Index soared to 63.1%, a gain of 6.9% from the reading of 56.2% in January. The Employment Index rose 2.5% in February to 55.6%, up from the January reading of 53.1%.

WHAT RESPONDENTS ARE SAYING
  • “[The] coronavirus has increased lead times for the critical items.” (Construction)
  • “[First-quarter numbers] are slightly behind projections, but still positive.” (Finance & Insurance)
  • “Because of the coronavirus, we are looking at major back-orders in masks, gloves, and PPE (personal protection equipment). A lot of the masks are manufactured in China, so not only are we facing a shortage because of the virus, there is a drastic shortage because the masks are manufactured where the virus originated.” (Health Care & Social Assistance)
  • “Business is rapidly improving.” (Management of Companies & Support Services)
  • “The business outlook remains positive, but foggy due to the Chinese coronavirus outbreak. The mining industry is well dependent on Chinese consumption. On the other side, it is difficult to [make] sourcing decisions, since it is not clear how long China will need to return to normal production capacity, and if it is worth it to pay more from other countries.” (Mining)
  • “The outlook appears positive, as our order book is nearing full capacity for the first half of 2020.” (Professional, Scientific & Technical Services)
  • “Construction activity appears to be getting off to a good start for 2020.” (Real Estate, Rental & Leasing)
  • “A post-holiday slow period for retail. Business is strong overall; however, volume and inventories are lower due to the season. Pricing is still in check, with specialty labor the primary price risk.” (Retail Trade)
  • “A shortage of workers at several levels is impacting the quality of employees we are looking to hire for capital projects we need to start.” (Transportation & Warehousing

ISM Non-Manufacturing Index (NMI) Beats Consensus Forecast

People's Pundit Daily
You have %%pigeonMeterAvailable%% free %%pigeonCopyPage%% remaining this month. Get unlimited access and support reader-funded, independent data journalism.

Start a 14-day free trial now. Pay later!

Start Trial