Widget Image
Follow PPD Social Media
Friday, January 10, 2025
HomeStandard Blog Whole Post (Page 47)

Consumer Confidence Index (CCI) Came in Less than Expected Amid Revision to January

Consumer confidence 3D gear graphic reporting the Conference Board Consumer Confidence Index.

The Conference Board Consumer Confidence Index (CCI) came in slightly higher at 130.7 (1985=100) in February, a solid reading slightly less than the consensus forecast and range low. The prior month was revised down from 131.6 to 130.4.

Forecasts for consumer confidence ranged from a low of 132.0 to a high of 134.0. The consensus forecast was 132.5.

“Consumer confidence improved slightly in February, following an increase in January,” said Lynn Franco, Senior Director of Economic Indicators. “Despite the decline in the Present Situation Index, consumers continue to view current conditions quite favorably.

“Consumers’ short-term expectations improved, and when coupled with solid employment growth, should be enough to continue to support spending and economic growth in the near term.”

The Present Situation Index — which gauges consumers’ assessment of current business and labor market conditions – fell from 173.9 to 165.1. But the Expectations Index gauging consumers’ short-term outlook for income, business and labor market conditions shot up from 101.4 to 107.8.

This article is being updated. Please refresh shortly.

The Consumer Confidence Survey is based on a probability-design random sample and is conducted monthly for The Conference Board by Nielsen. The cutoff date for the preliminary results was February 13.

The Conference Board Consumer Confidence Index (CCI)

U.S. house prices rose 1.3% in the fourth quarter (4Q) of 2019 and 5.1% from Q4 2018, according to the Federal Housing Finance Agency (FHFA) House Price Index (HPI).

FHFA’s seasonally adjusted monthly index for December was up 0.6 % from November.

“Growth in U.S. home prices stabilized at the end of 2019 with fourth quarter prices increasing 5.1% from the same period a year ago,” Dr. Lynn Fisher, Deputy Director of the Division of Research and Statistics at FHFA. “The revised measure of home price growth in the third quarter was also 5.1%.”

“Prices in the Mountain region had the highest gains, posting a 6.7 annual growth rate in the fourth quarter.”

Significant Findings (via FHFA)

  • U.S. House prices have risen for 34 consecutive quarters, or since September, 2011. 
  • House prices rose in all 50 states and the District of Columbia between the fourth quarters of 2018 and 2019.  The top five areas in annual appreciation were: 1) Idaho 12.0 percent; 2) Utah 8.1%; 3) Arizona 7.0%; 4) Washington 7.0%; and 5) Indiana 7.0%.  The areas showing the smallest annual appreciation were:  1) Connecticut 1.9%; 2) Illinois 2.0 percent; 3) Iowa 2.1 percent; 4) Mississippi 2.8%; and 5) Louisiana 3.0%.
  • House prices rose in 97 of the top 100 largest metropolitan areas in the U.S. over the last four quarters.  Annual price increases were greatest in Boise City, ID, where prices increased by 12.7%.  Prices were weakest in Albany-Schenectady-Troy, NY, where they fell by -1.8 percent.
  • Of the nine census divisions, the Mountain division experienced the strongest four-quarter appreciation, posting a 6.7% gain between the fourth quarters of 2018 and 2019 and a 1.4% increase in the fourth quarter of 2019. Annual house price appreciation was weakest in the New England division, where prices rose by 3.9% between the fourth quarters of 2018 and 2019.

The FHFA House Price Index (HPI) finds

While Home Prices Have Risen for 8 Straight Years, 2019 Was 59% Higher than Trough in 2012

The S&P CoreLogic Case-Shiller U.S. National Home Price Index (HPI) for all nine U.S. census divisions posted a 3.8% annual gain in December, up from 3.5% in the previous month (NSA). The 20-City Composite (NSA) posted a 2.9% year-over-year gain, up from 2.5% last month and beating the forecast.

Forecasts for the 20-City Composite year-over-year ranged from a low of 2.4% to a high of 3.0%. The consensus forecast was 2.8%.

The 10-City Composite annual gain came in at 2.4%, up from 2.0% in the prior month.

“The U.S. housing market continued its trend of stable growth in December,” says Craig J. Lazzara, Managing Director and Global Head of Index Investment Strategy at S&P Dow Jones Indices. “December’s results bring the National Composite Index to a 3.8% increase for calendar 2019.

Phoenix, Charlotte and Tampa posted the highest year-over-year gains among the 20 cities. Phoenix came in at a 6.5% year-over-year price increase, followed by Charlotte and Tampa at 5.3% and 5.2%, respectively.

“At a regional level, Phoenix retains the top spot for the seventh consecutive month, with a gain of 6.5% for December,” Mr. Lazzara added. “Charlotte and Tampa rose by 5.3% and 5.2% respectively, leading the Southeast region. The Southeast has led all regions for the past year.”

Twelve of the 20 cities posted greater price gains in the year ending December 2019 versus the year ending November 2019.

The S&P CoreLogic Case-Shiller 20-City Composite (NSA)

The Chicago Fed National Activity Index (CFNAI) rose from -0.51 to -0.25 in January, beating the consensus forecast and indicating an uptick in growth. That increase comes after a sharp decrease in December and a rebound in November.

Forecasts ranged from a low of -0.9 to a high of -0.2. The consensus forecast was -0.6.

All four broad categories of indicators rose, but only one made a positive contribution to the index in January. The index’s three-month moving average, CFNAI-MA3, rose to –0.09 from –0.23.

The CFNAI Diffusion Index — also a three-month moving average — rose to –0.16 in January from –0.25 in December. Thirty-six of the 85 individual indicators made positive contributions to the CFNAI, while 49 made negative contributions.

Fifty-six indicators improved from December to January, while 27 indicators deteriorated. Two were unchanged. Of the indicators that improved, 30 made negative contributions.

The Chicago Fed National Activity Index (CFNAI) is a weighted average of 85 indicators of growth in national economic activity derived from four broad categories: 1) production and income; 2) employment, unemployment, and hours; 3) personal consumption and housing; and 4) sales, orders, and inventories.

The Chicago Fed National Activity Index (CFNAI)

Senator Bernie Sanders speaks to supporters ahead of the 2020 Nevada Democratic Caucus.

Las Vegas — Bernie Sanders has won the Nevada caucus, People’s Pundit Daily (PPD) can project with 3% of precincts reporting. The socialist senator from Vermont has now won at least two of the first three contests — likely all three — sealing his status as front-runner for the 2020 Democratic nomination.

He currently leads Joe Biden in county convention delegates (C.C.D.s) and also in the first and final alignment votes.

Election 2020: Nevada Caucus Results

Early Takeaways

Nevada is the first contest with a large share of nonwhites, representing roughly 4 in 10 in 2016 and 35% in 2020, according to entrance polls. Sanders overwhelmingly won the Hispanic vote in the Silver State, 54% to 14%, a larger margin than in Iowa and New Hampshire.

White
65%
Black
11%
Hispanic
18%
Asian
3%
Other
4%
Sanders29%27%51%n/a42%
Biden14%39%17%n/a11%
Buttigieg19%2%10%n/a12%
Gabbard1%1%0%n/an/a
Klobuchar14%3%4%n/a9%
Steyer7%16%8%n/a13%
Warren14%10%7%n/a9%
Uncommitted1%1%1%n/a4%

Biden won the black vote by just 6 points, raising an eyebrow ahead of South Carolina where the former Vice President’s lead is fading quickly.

Pete Buttigieg failed in his first test to compete among diverse demographics. He won just 9% of the Hispanic vote and only 2% of the black vote.

This story is developing and the article is being updated.

Senator Bernie Sanders speaks to supporters ahead

Election 2020: Live results and entrance polls for the Nevada Caucus.

Entrance Polls | Popular Vote | Polls

Candidate Total C.C.D.s* Pct. Pledged delegates
Bernie Sanders 6,788 46.8% 24
Joseph R. Biden Jr. 2,927 20.2 9
Pete Buttigieg 2,073 14.3 3
Elizabeth Warren 1,406 9.7 0
Tom Steyer 682 4.7 0
Amy Klobuchar 603 4.2 0
Tulsi Gabbard 4 0.0 0
Andrew Yang 1 0.0 0
Deval Patrick 0 0.0 0
Michael Bennet 0 0.0 0
John Delaney 0 0.0 0
Uncommitted 7 0.0 0

2,097 of 2,097 precincts

County convention delegates (C.C.D.s) are derived from popular caucus votes and determine the number of pledged delegates.

How Democrats Voted in First and Final Rounds

Candidate Votes Pct. Votes Pct. Votes Pct.
Sanders 35,652 34.0% 41,075 40.5% 6,788 46.8%
Biden 18,424 17.6 19,179 18.9 2,927 20.2
Buttigieg 16,102 15.4 17,598 17.3 2,073 14.3
Warren 13,438 12.8 11,703 11.5 1,406 9.7
Steyer 9,503 9.1 4,120 4.1 682 4.7
Klobuchar 10,100 9.6 7,376 7.3 603 4.2
Uncommitted 472 0.4 367 0.4 7 0.0
Gabbard 353 0.3 32 0.0 4 0.0
Yang 612 0.6 49 0.0 1 0.0
Bennet 140 0.1 36 0.0 0 0.0
Patrick 86 0.1 8 0.0 0 0.0
Delaney 1 0.0 0 0.0 0 0.0

104,883 first alignment votes, 101,543 final alignment votes, 100% reporting

What Did the Nevada Caucus Polls Find?

Live results and entrance polls for the

NAR: ‘Existing Home Sales Are Off to a Strong Start’ in 2020

WASHINGTON, D.C. – Existing home sales fell 1.3% in January on weakness in the West, but still met expectations and are 9.6% higher than they were a year ago. The National Association of Realtors (NAR) said it’s a continuation of “a fluctuating pattern of monthly increases and declines.”

Total existing-home sales — defined as completed transactions that include single-family homes, townhomes, condominiums and co-ops — decreased to a seasonally-adjusted annual rate of 5.46 million. However, overall sales year-over-year were up big (9.6%) for a second straight month.

“Existing-home sales are off to a strong start at 5.46 million.” Lawrence Yun, NAR’s chief economist said. “The trend line for housing starts is increasing and showing steady improvement, which should ultimately lead to more home sales.”

Forecasts for existing home sales in January ranged from a low of 5.300 million to a high of 5.600 million. The consensus forecast was 5.450 million, down slightly from the initial 5.540 million reported for December.

A significant drop in the West region weighed down the percentage nationwide. The other three major U.S. regions reporting marginal or essentially no changes from the prior month.

The median existing-home price for all housing types was $266,300 in January, up 6.8% from January 2019 ($249,400). Prices rose in every region. December’s price increase marks 95 straight months of year-over-year gains.

Total housing inventory at the end of January totaled 1.42 million units, up 2.2% from December, but down 10.7% from one year ago (1.59 million). The housing inventory level for January is the lowest level since 1999. Unsold inventory sits at a 3.1-month supply at the current sales pace, up from the 3.0-month figure recorded in December and down from the 3.8-month figure recorded in January 2019.

“Mortgage rates have helped with affordability, but it is supply conditions that are driving price growth,” Yun added.

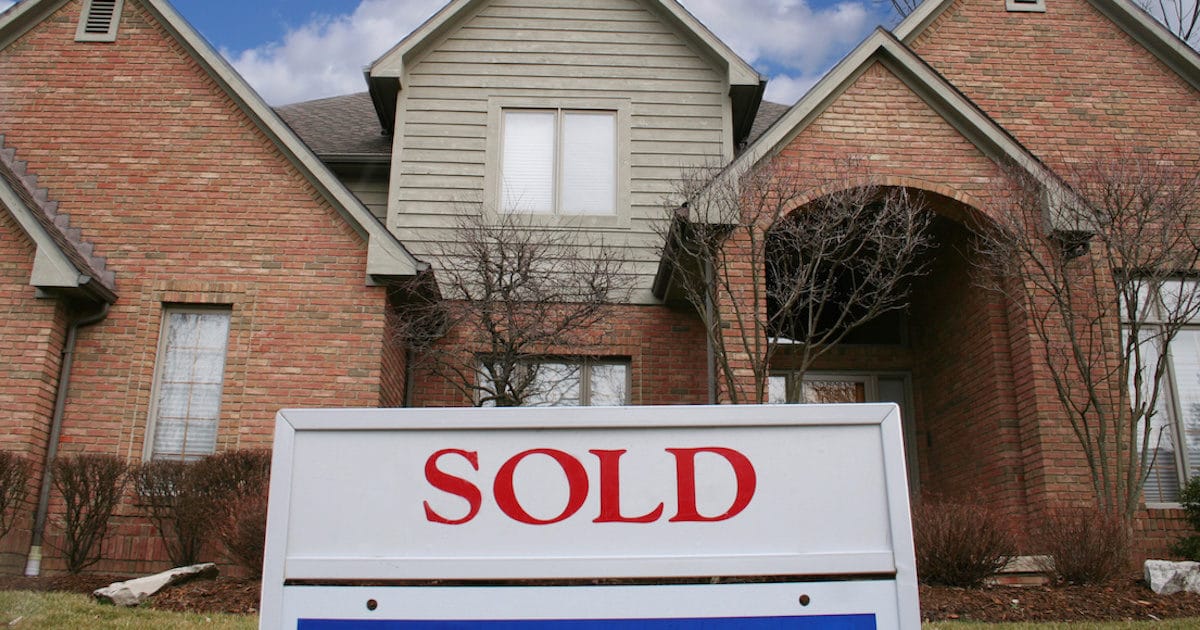
File photo: A sold sign on an existing home. (Photo: AdobeStock)

Existing Home Sales Regional Breakdown

In the Northeast, existing home sales were flat at an annual rate of 730,000, which is up 7.4% higher than one year ago. The median price in the was $312,100, up 11.5% year-over-year.

Existing home sales rose 2.4% in the Midwest to an annual rate of 1.29 million and are up 8.4% from a year ago. The median price was $200,000, a gain of 5.4% from January 2019.

In the South, existing home sales ticked slightly higher 0.4% to an annual rate of 2.38 million, up 11.7% year-over-year. The median price was $229,900, up 6.3% from one year ago.

Existing home sales in the West fell 9.4% to an annual rate of 1.06 million, though are still 8.2% higher than a year ago. The median price was $393,800, up 5.2% from January 2019.

Existing home sales fell 1.3% in January

4-Week Moving Average for Jobless Claims Down to Only 209K

The U.S. Labor Department (DOL) reported initial jobless claims came in at a seasonally adjusted 210,000 for the week ending February 15, beating the consensus forecast. The previous week was revised higher by just 1,000 to 206,000.

Forecasts ranged from a low of 210,000 to a high of 217,000. The consensus forecast was 211,000.

The 4-week moving average was only 209,000, a decrease of 3,250 from the previous week’s slightly higher revised average. Last week was revised up by just 250.

Lagging Jobless Claims Data

U.S. initial jobless claims graph on a tablet screen. (Photo: AdobeStock)

The advance seasonally adjusted insured unemployment rate was unchanged at a very low 1.2% for the week ending February 8.

The advance number for seasonally adjusted insured unemployment during the week ending February 8 was 1,726,000, an increase of 25,000. The previous week’s level was revised up by 3,000 from 1,698,000 to 1,701,000.

The 4-week moving average was 1,722,250, a decrease of 5,250. The previous week’s average was revised up by 750 from 1,726,750 to 1,727,500.

No state was triggered “on” the Extended Benefits program during the week ending February 1.

State Jobless Claims Data

The highest insured unemployment rates in the week ending February 1 were in Alaska (3.0), New Jersey (2.7), Puerto Rico (2.7), Connecticut (2.5), Montana (2.5), West Virginia (2.5), Pennsylvania (2.4), Rhode Island (2.3), Illinois (2.2), and Minnesota (2.2).

The largest increases in initial claims for the week ending February 8 were in New Jersey (+984), Washington (+542), Virginia (+522), Nevada (+508), and Illinois (+451), while the largest decreases were in California (-3,066), New York (-1,535), Pennsylvania (-1,468), Missouri (-1,131), and Iowa (-687).

Initial jobless claims came in at a

Philly Fed Mid-Atlantic Manufacturing Index More than Triples Consensus Forecast

Manufacturing Export Wooden Crate, reading Made in Pennsylvania. 3D Illustration. (Photo: AdobeStock)

The Manufacturing Business Outlook Survey — the Philadelphia Federal Reserve’s index for Mid-Atlantic factory activity — more than tripled the forecast in February, jumping to the highest level in three years.

The diffusion index for current general activity rose nearly 20 points to 36.7, its highest reading since February 2017. Forecasts ranged from a low of 8.0 to a high of 14.6. The consensus forecast was 12.0.

The percentage of firms reporting increases — at 52% — far exceeded the percentage reporting decreases — at just 15%. The index for new orders jumped 15 points to 33.6, the highest reading since May 2018.

Over 50% of the firms reported an increase in new orders in February, up from 46% in January.

The Federal Reserve Bank of New York released the Empire State Manufacturing Survey on Tuesday. Regional manufacturing in the Northeast also roughly tripled the consensus forecast.

The Philadelphia Fed's Manufacturing Business Outlook Survey

Debate Fireworks Smoke Out Bloomy the Billionaire in Vegas

Michael Bloomberg, the billionaire former New York City mayor and 2020 Democratic candidate, at the Democratic debate in Las Vegas, Nevada. (Photo: Screenshot)

(Las Vegas, Nevada) — Michael Bloomberg bombed under the pressure of attacks from rival candidates at the Democratic debate in Las Vegas on Wednesday.

Big picture, Donald Trump won that debate because it no doubt scare the hell out of the American Middle.

Elizabeth Warren came out swinging, saying his record was filled with “racist policies” and “another billionaire” who calls women “fat broads and horse-face lesbians.”

NPR/PBS NewsHour/Marist national survey released on Tuesday found the former New York mayor in second place at 19%. It is the fourth national poll in which he is at or above 10% nationally and qualified him for the debate.

The Bloomberg Campaign released a post-debate memo conceding Sanders is “likely to open up a delegate lead that will seem nearly impossible to overcome.”

Sanders holds a lead in Nevada, one which the PPD Election Projection Model cautioned may be bigger than some polls indicate. As of Monday morning, the Turnout Probability Model gave Sanders a lead ceiling of 13 points and a floor just below 8 points.

While the Las Vegas Review-Journal Poll found Bernie Sanders leading Joe Biden 25% to 18%, a new poll conducted by the liberal firm Data for Progress gives him a 19-point lead.

The Silver State is the first with a large percentage of Hispanics in the electorate. According to 2016 entrance polls, Hispanic caucus-goers on the Democratic side accounted for roughly 20%.

Michael Bloomberg bombed under the pressure of

People's Pundit Daily
You have %%pigeonMeterAvailable%% free %%pigeonCopyPage%% remaining this month. Get unlimited access and support reader-funded, independent data journalism.

Start a 14-day free trial now. Pay later!

Start Trial