Widget Image
Follow PPD Social Media
Friday, January 10, 2025
HomeStandard Blog Whole Post (Page 55)

Trump Approval Inches Higher Ahead of Farm Bureau Convention

President Donald Trump’s approval among farmers ticked even higher to 83% in January, the highest level ever measured by the Farm Journal Pulse Poll. That’s up one point from the previous high at 82% in December and 78% in November.

The percentage of farmers who “strongly approve” of the president’s job performance rose to 64% in January, up from 61% at the end of 2019.

Only 16% disapprove, down one point from December.

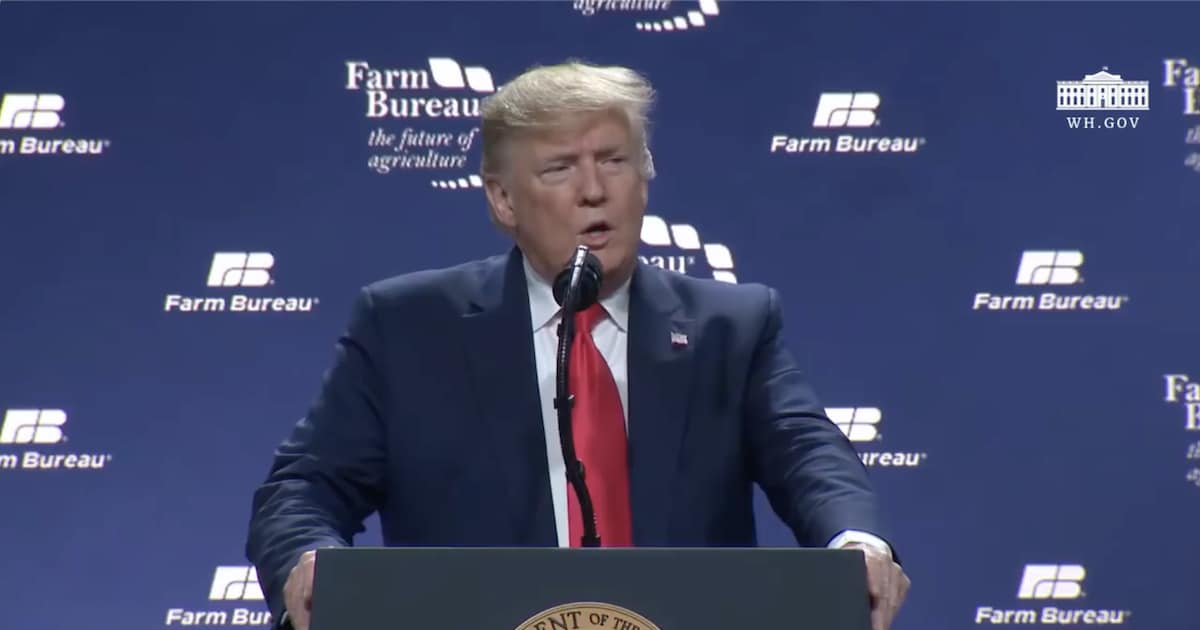
The new record comes as the president touts trade accomplishments promised during the 2016 campaign, which will undoubtedly benefit farmers who have been targeted by China during negotiations. He also visited the American Farm Bureau Federation Annual Convention for the third consecutive year.
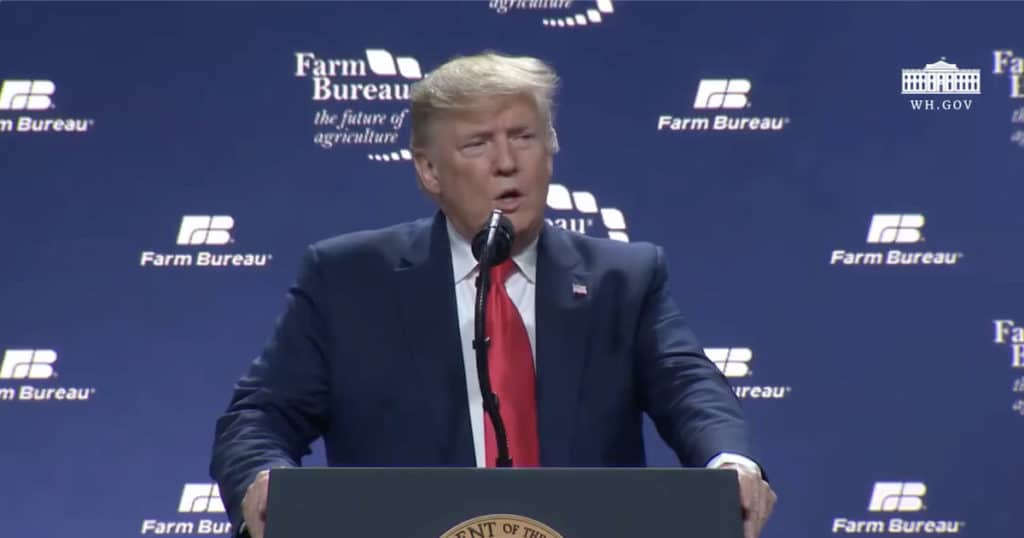
President Donald Trump speaks at the American Farm Bureau Federation Annual Convention and Trade Show in Austin, Texas, on Sunday, January 19, 2020.

The president signed Phase One of the U.S.-China Trade Deal last Wednesday. and the U.S. Senate passed the United States Mexico Canada Trade Agreement (USMCA) last Thursday.

The former will provide long-denied access to markets and tariff relief to farmers. China agreed to purchase roughly $36 billion in U.S. agricultural exports in 2020, and more than $43 billion in 2021.

The latter replaces the deeply unpopular North American Free Trade Agreement (NAFTA).

“Of note is the strongly approve category went up three percentage points from an already lofty (December) number and his highest overall approval ratings ever,” notes Pro Farmer policy analyst Jim Wiesemeyer. “That says the president’s approval is rock-solid.

“With the recent upbeat news on USMCA and the Phase 1 accord with China, the ratings will likely remain firm ahead.”
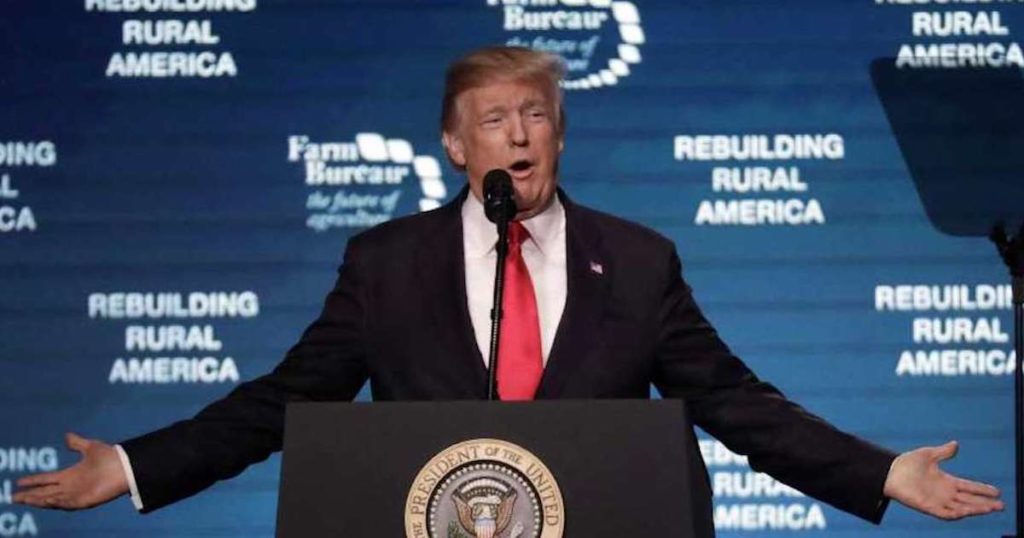
President Donald Trump speaks at the American Farm Bureau Federation annual convention Monday, January 8, 2018, in Nashville, Tennessee. (Photo: SS)

In 2016, the president won Iowa by roughly 10 points, the first Republican to carry the Hawkeye State since George W. Bush barely eked out a victory in 2004. Mr. Bush edged John Kerry by just 49.90% to 49.23%.

President Trump defeated Hillary Clinton in Iowa by 51.15% to 41.74% and nearly defeated her in Minnesota. The Twin Cities State—which voted 46.44% to 44.92% for Mrs. Clinton—is another that could prove pivotal in 2020.

“Trump needs the rural vote to keep the same states he won in 2016 in his win column come November,” Wiesemeyer says. “In fact, contacts say he is focusing on winning Minnesota this time as a backstop should he lose a state he won in 2016.”

“That means agriculture will continue to be a key topic in the president’s re-election campaign.”

The Farm Journal Pulse Poll for January was based on 1,286 responses out of roughly 5,000 ranchers and farmers collected via text message/SMS. While technically nationwide, respondents are heavily concentrated in Corn Belt and Midwest states such as Iowa, Indiana, Illinois and Nebraska.

President Donald Trump's approval among farmers ticked
Survey of Consumers: Impeachment/Removal Concerns Nil

The Survey of Consumers preliminary reading on consumer sentiment for January was virtually unchanged, easing just 0.2 to 99.1. The index ended 2019 averaging above 97.0 under the Trump Administration, the highest sustained level since the all-time record in the late 1990s.

Forecasts for the Consumer Sentiment Index ranged from a low of 97.5 to a high of 101.5. The consensus forecast was 99.3.

“Impeachment was barely mentioned–just by 1% of consumers,” said Richard Curtain, chief economist for the Survey of Consumers.

“While those that mentioned impeachment were also somewhat less optimistic than other consumers, the small numbers had a negligible impact on the overall level in consumer sentiment.”

The Current Economic Conditions rose slightly from 115.5 in December to 115.8 in the preliminary reading for January. The Index of Consumer Expectations declined slightly from 88.9 to a preliminary reading of 88.3.

Mr. Curtain noted the Consumer Sentiment Index also rose after the U.S. House voted to impeach Bill Clinton in December 1998. It jumped nearly 8 points when the U.S. Senate voted to acquit.

“Importantly, the economic expansion lasted another two years, with the economy peaking in March 2001, setting the record for the longest expansion since the mid-1950s,” he added. “The current expansion has established a new record length largely due to consumer spending.”

The Survey of Consumers anticipates consumers will continue to sustain the expansion given sustained historically high levels of sentiment. Consumer sentiment is being driven by favorable views of both current and prospective financial conditions.

Mr. Curtain appears to warn of rolling back economic policies that fueled the surge in consumer sentiment and economic activity under the Trump Administration.

“Of course, whether that strength will last another two years is uncertain, given that the election season has only begun and features fundamental changes in taxes and spending programs that directly affect consumers.”

The final reading on consumer sentiment by the Survey of Consumers is scheduled be released on Friday, January 31, 2020 at 10am ET.

The Survey of Consumers preliminary reading on

The Federal Reserve said industrial production fell 0.3% in December, as a decline of 5.6% in utilities outweighed gains of 0.2% and 1.3% in manufacturing and mining, respectively.

Forecasts for industrial production ranged from a low of 0.5% to a high 1.1%. The consensus was 0.9%. Forecasts for manufacturing output ranged from a low of -1.0% to a high 0.2%. The consensus was 0.2%.

The drop for utilities resulted from a large decrease in demand for heating, as unseasonably warm weather in December followed unseasonably cold weather in November. For the fourth quarter as a whole, total industrial production moved down at an annual rate of 0.5 percent.

At 109.4% of its 2012 average, total industrial production was 1.0% lower in December than it was a year earlier. Capacity utilization for the industrial sector fell 0.4 percentage point in December to 77.0%, a rate that is 2.8 percentage points below its long-run (1972–2018) average.

Forecasts for the capacity utilization rate ranged from a low of 76.9% to a high 77.4%. The consensus was 77.1%.

Regional manufacturing surveys in the Northeast and Mid-Atlantic signal factory activity picked up in January.

While manufacturing output rose 0.2% in December, it decreased by an annual rate of 1.0% in the fourth quarter of 2019. Worth noting, the gain posted despite a 4.6% decline for motor vehicles and parts; assemblies of light motor vehicles falling from 11.2 million units (annual rate) to 10.3 million units.

Capacity utilization for manufacturing edged up 0.1 percentage point to 75.2%, about 3.1 percentage points below its long-run average.

The utilization rate for mining increased to 89.6%, remaining above its long-run average of 87.1%. The operating rate for utilities fell to 73.5%, a rate that is about 12 percentage points below its long-run average.

Industrial production fell 0.3% in December, as

New Residential Construction Ends 2019 Very Strong, Reflecting High Builder Confidence

New residential construction statistics for December show housing starts soared 16.9% in December. That level reflects historically high builder confidence at the end of the year, as reported on Thursday.

New residential construction, hew homes, housing starts, building permits, depicted on blueprints. (Photo: AdobeStock)

Building Permits

Privately‐owned housing units authorized by building permits came in at a seasonally adjusted annual rate of 1,416,000 in December. While that’s a decline of 3.9% (±1.6) from the upwardly revised November rate of 1,474,000, it is 5.8% (±1.1%) higher than the December 2018 rate of 1,339,000.

Single‐family authorizations in December came in at a rate of 916,000, or 0.5% (±1.3%) below the upwardly revised November figure of 921,000. Authorizations of units in buildings with five units or more came in at a rate of 458,000 in December.

An estimated 1,368,800 housing units were authorized by building permits in 2019. That’s an increase of 3.9% (±0.6%) from the 2018 figure of 1,317,900.

Housing Starts

Privately‐owned housing starts in December came in at a seasonally adjusted annual rate of 1,608,000, soaring 16.9% (±12.8%) from the upwardly revised November estimate of 1,375,000. That is also 40.8% (±20.5%) higher than the December 2018 rate of 1,142,000.

Single‐family housing starts in December came in at a rate of 1,055,000, an increase of 11.2% (±10.4%) from the upwardly revised November figure of 949,000. The December rate for units in buildings with five units or more was 536,000.

An estimated 1,289,800 housing units were started in 2019, an increase of 3.2% (±2.3%) from the 2018 figure of 1,249,900.

Housing Completions

Privately‐owned housing completions in December came in at a seasonally adjusted annual rate of 1,277,000, an increase of 5.1% (±15.1%) from the upwardly revised November estimate of 1,215,000. It is 19.6% (±14.1%) higher than the December 2018 rate of 1,068,000.

Single‐family housing completions in December came in at a rate of 912,000, an increase of 0.7% (±13.5%) from the upwardly revised November rate of 906,000. The December rate for units in buildings with five units or more was 357,000.

An estimated 1,250,600 housing units were completed in 2019, an increase of 5.6% (±4.0%) from the 2018 figure of 1,184,900.

New residential construction statistics for December show

U.S. President Donald J. Trump, left, delivering remarks at the White House after the ineffective Iran missile attack on U.S. and allies in Iraq on Wednesday, January 8, 2020, and Iran Supreme Leader Ayatollah Ali Khamenei, right.

Many elected officials lack real life experiences, which is why they treat the Middle East as some geopolitical Rubik’s cube. It’s really not that complicated.

Just spend some time in a schoolyard filled with inner city kids. There are many similarities with the current state of U.S.-Iranian relations to a slice of concrete in Brooklyn. President Obama never understood the politics of a schoolyard. President Trump does.

The Islamic Republic of Iran has been the foremost sponsor of international terrorism since 1979. They provide training, funding, and political guidance to a variety of militant Islamic groups. They especially enjoy killing Americans referring to us as, The Great Satan. Iran and their thugs are the bad kids, whose goal is to control the entire schoolyard.

The schoolyard is also home to good kids, weak kids, a few jocks and there’s always one big nice kid. A polite kid who’s tall, muscular and captain of the football team. A kid not looking for trouble. He warns the bullies not to pick on the weak kids but practices restraint even when they keep poking away. They begin to sense weakness in the big nice kid until he draws a red line. “Don’t hit another friend of mine or they’ll be a price to pay.” The bullies ignore the warning and the big kid kicks their butts. It makes them very reluctant to cross that line again.

Representative IIhan Omar declared, “We are outraged the president would assassinate a foreign official.”

Omar, and the majority her Democratic colleagues, felt Iranian Major-General Qassem Soleimani was off limits to American retaliation since he was an uniformed member of a sovereign nation and therefore bullet proof. They are predicting Iran will extract their revenge by killing many Americans. They rationalize that striking back at our enemies will only escalate into World War III.

This is the faulty policy of appeasement, a policy which failed tragically with another uniformed member of a sovereign nation. It also fails in schoolyards.

During the 1930s, Great Britain followed a policy of appeasement. They gave Adolf Hitler whatever he wanted in order to keep the peace. He sensed weakness and continued to invade countries until he controlled most of Europe, North Africa and the Middle East. The Fuhrer awaited a military response but when none came, he took France. The German leader would openly mock British Prime Minister Neville Chamberlin, calling him a sissy.

Why did Britain adopt this policy of appeasement?

It was based on the idea that Hitler’s demands were reasonable and, when he concluded his hissy fit in the remainder of Europe, Germany wouldn’t attack England. The Nazi’s appetite for domination would be sated with Czechoslovakia, Denmark, Austria, Poland, and Norway. This logic is similar to the Iran nuclear deal when President Obama practiced appeasement by sending billion dollars in cash as Iran’s supreme leader screamed, “Death to America.”

Obama was a very weak kid in the schoolyard, who gave his lunch money to the bullies.

The Ayatollah Ali Khamenei is the supreme leader of Iran. There was the blood of hundreds of Americans on that Obama cash when General Soleimani directed operations against U.S. military personnel in Iraq by Shia militias.

The basic belief of all appeasers is that wars have no winners, only losers. That proved the opposite in WW II. Had England, France and other European nations stopped Hitler in the beginning, millions upon millions of lives would have been saved and the holocaust prevented.

Iranians view us as weak and stupid as they scream at the cameras while thumping their chests. It’s basically performance art. They gather, burn our flag, and threaten annihilation.

Our leaders have rarely understood the mindset of our enemies. They view them through the lens of the American sense of fair play but that never works whether it be Tehran or the Brooklyn schoolyard. Iran doesn’t think like us and required some schoolyard justice, which President Trump provided.

The dynamics of a schoolyard is identical to international relations. The United States is the biggest kid in the schoolyard. There’s no need to overreact, kill innocent civilians, or destroy the culture of Iran, North Korea, or Russia. But occasionally they require a reminder, other that verbal threats, something like a rocket up the butt of Gen. Qassem Soleimani.

John Ligato, a retired FBI agent, is the author of five books, including his latest —> The Comey Gang: An Insider’s Look at an FBI in Crisis.

Many elected officials lack real life experiences,

The National Association of Home Builders/Wells Fargo Housing Market Index (HMI) finds builder confidence in the market for newly-built single-family homes edged one point lower to 75 in January. The last two monthly readings mark the highest sentiment levels since July of 1999.

“Low interest rates and a healthy labor market combined with a need for additional inventory is setting the stage for further home building gains in 2020,” said NAHB Chairman Greg Ugalde, a home builder and developer from Torrington, Conn.

Forecasts for the HMI ranged from a low of 67 to a high of 77. The consensus forecast was 75.

“With the Federal Reserve on pause and attractive mortgage rates, the steady rise in single-family construction that began last spring will continue into 2020,” said NAHB Chief Economist Robert Dietz. “However, builders continue to grapple with a shortage of lots and labor while buyers are frustrated by a lack of inventory, particularly among starter homes.”

NAHB has conducted a monthly survey for 30 years. The NAHB/Wells Fargo Housing Market Index (HMI) gauges builder confidence in current single-family home sales, and gauges sales expectations for the next six months as “good,” “fair” or “poor.”

The HMI also asks builders to rate traffic of prospective buyers as “high to very high,” “average” or “low to very low.” A reading above 50 indicates that more builders view conditions as good than poor.

The HMI index charting traffic of prospective buyers increased one point to 58, the highest level since December 2017. The gauge measuring current sales conditions fell three points to 81 and the component measuring sales expectations in the next six months held steady at 79.

Three-Month Moving Averages for Regional HMI

The three-month moving averages for the Northeast HMI rose one point to 62, while the Midwest increased three points to 66. The West inched up one point to 84 and the South was unchanged at 76.

You Might Also Like

Builder confidence in the market for newly-built

Philadelphia Fed Survey Suggests Continued Growth for Next Six Months

The Philadelphia Fed’s Manufacturing Business Outlook Survey rose 15 points in January to 17, nearly six times the consensus forecast. Indicators for current activity, new orders, shipments, and employment were all positive and increased from December.

The survey’s future activity indexes remained at relatively high readings, suggesting continued optimism about growth for the next six months.

Forecasts for the headline diffusion index ranged from a low of -4.0 to a high of 5.0. The consensus forecast was only 3.0.

The percentage of the firms reporting increases (39%) was greater than the percentage reporting decreases (22%).

The current new orders index increased 7 points, and the shipments index increased 8 points.

Employment

The employment index increased 3 points to 19.3. Nearly 28% of manufacturing firms in the region reported higher employment, while 9% reported lower employment. The average workweek index remained positive but ticked down 3 points.

Future Optimism

The diffusion index for future general activity edged higher 4 points to 38.4 in January, from a revised reading of 34.8 in December.

More than 49% of the firms expect increases in activity over the next six months, while 11% expect declines. The future new orders and shipments indexes also increased, by 8 points and 4 points, respectively.

While the future employment index fell 3 points, one-third of firms still expect higher employment over the next six months.

Manufacturing firms in the region were also more optimistic about future capital spending: The future capital expenditures index rose 7 points, with 39% expecting higher capital spending over the next six months.

The Philadelphia Fed's Manufacturing Business Outlook Survey

The advance estimates of U.S. retail sales for December was $529.6 billion, an increase of 0.3% (±0.4%) from November, and 5.8% (±0.7%) year-over-year. 

Forecasts ranged from a low of 0.2% to a high of 0.6%. The consensus forecast was 0.4%.

Total sales for the 12 months of 2019 increased 3.6% (±0.4%) from 2018. Total sales for the period from October 2019 to December 2019 gained 4.1% (±0.5%) from the same period a year ago.

The October 2019 to November 2019 percent change was revised from up 0.2% (±0.4%) to up 0.3% (±0.3%).

Retail trade sales were up 0.4% (±0.4%) from November 2019, and 6.0% (±0.5%) above last year. Nonstore retailers were up 19.2% (±1.4%) from December 2018, and gasoline stations were up 11.3% (±1.2%) from last year.

The advance estimates of U.S. retail sales

Weekly Jobless Claims Continue Downward Trend in 2020

The U.S. Labor Department (DOL) reported initial jobless claims fell 10,000 to just 204,000 for the week ending January 11, again beating the forecast. The previous week’s level was unrevised at 214,000.

Forecasts for initial jobless claims ranged from a low of 210,000 to a high of 220,000. The consensus forecast was 215,000.

The 4-week moving average was 216,250, a decrease of 7,750 from the previous week’s revised average. The previous week’s unrevised average.

Lagging Jobless Claims Data

U.S. initial jobless claims graph on a tablet screen. (Photo: AdobeStock)

The advance seasonally adjusted insured unemployment rate was unchanged at a very low 1.2% for the week ending January 4.

The advance number for seasonally adjusted insured unemployment during that week was 1,767,000, a decrease of 37,000. The previous week’s level was revised up 1,000 from 1,803,000 to 1,804,000.

The 4-week moving average was 1,755,500, an increase of 10,500. The previous week’s average was revised up by 250 from 1,744,750 to 1,745,000.

No state was triggered “on” the Extended Benefits program during the week ending December 28, the Labor Department said.

State Jobless Claims Data

The highest insured unemployment rates in the week ending December 28 were in Alaska (3.3), Connecticut (2.8), New Jersey (2.8), Rhode Island (2.6), Minnesota (2.4), Montana (2.4), West Virginia (2.4), Iowa (2.3), Pennsylvania (2.3), and Massachusetts (2.2).

The largest increases in initial claims for the week ending January 4 were in New York (+26,462), Georgia (+12,929), South Carolina (+5,290), Texas (+3,420), and Connecticut (+3,168), while the largest decreases were in New Jersey (-7,530), Iowa (-5,752), Michigan (-5,689), Ohio (-5,184), and Illinois (-4,758).

The U.S. Labor Department (DOL) reported initial

People's Pundit Daily
You have %%pigeonMeterAvailable%% free %%pigeonCopyPage%% remaining this month. Get unlimited access and support reader-funded, independent data journalism.

Start a 14-day free trial now. Pay later!

Start Trial