Widget Image
Follow PPD Social Media
Saturday, January 11, 2025
HomeStandard Blog Whole Post (Page 72)

Jerome Powell Echoes Janet Yellen, Shoots Down Yield Curve Talk, Says Fed Has “Favorable Outlook” for U.S. Economy

Federal Reserve Chairman Jerome Powell shot down recent media speculation about the yield curve signaling a recession on the horizon. On Wednesday, the Fed announced an expected 25 basis points cut to the federal funds rate.

The cut puts the rate at a range of 1.75% to 2.00%, with an implied midpoint of 1.875%.

Fed Chairman Powell said the U.S. central bank has “a favorable outlook” on the U.S. economy and attributed the slight slowdown in the first half of the year largely to global economic influence.

“So, as I mentioned, we don’t see a recession. We’re not forecasting a recession,” he said. “But we are adjusting monetary policy in a more accommodated direction to try to support what is in fact a favorable outlook.”

The European Central Bank (ECB) announced last Thursday they were lowering their deposit rate from -0.4% to -0.5%. Further, they will be restarting an “open-ended” quantitative easing (QE) bond-buying program in November at a scale of €20 billion per month.

Trade uncertainty and policy apparently also has an effect. So, you can see some weakness in the U.S. economy because of all that. But nonetheless, the job of monetary policy is to adjust both to insure against those downside risks but also to support the economy in light of the existing weakness we do see.

Federal Reserve Chairman Jerome Powell – September 18, 2019

“Global growth will have an effect on U.S. growth over time, less so for any other economy,” the Fed Chair added. “But still, there’s a sector of our economy that’s exposed to that.”

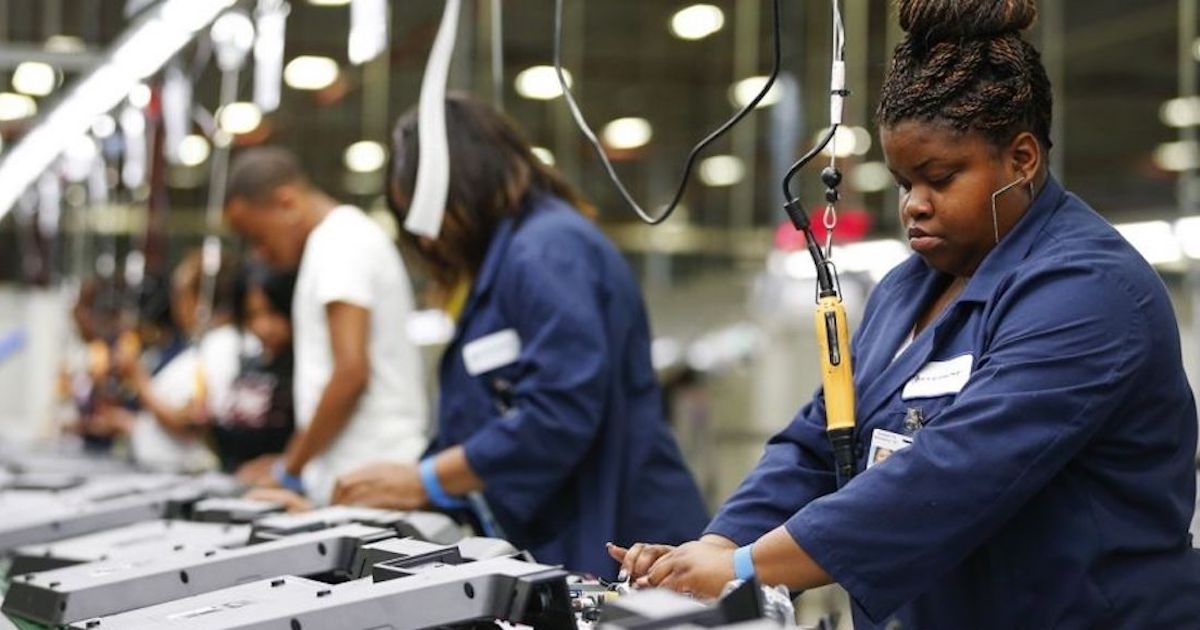
He was referring to the U.S. manufacturing sector. But industrial production earlier this week indicated manufacturing could be back on the upswing. Manufacturing output for August more than recovered the losses in July.

While factory output has risen just 0.2% per month over the past 4 months, it fell 0.5% per month during the first 4 months of 2019. For mining output, the Federal Reserve said the dip in July was due to a cutback in oil extraction in the Gulf of Mexico in response to Hurricane Barry. 

When asked about the inverted yield curve “signaling a recession,” he noted noted the inverted yield curve was not a “material change” and it wasn’t “sustained” over time.

Federal Reserve Chair Jerome Powell answers questions at a press conference on September 18, 2019. (Photo: Courtesy of Federal Reserve)

“We monitor the yield curve carefully along with a wide range of financial conditions,” the chairman said. “There’s no one thing that’s despondent of all financial conditions. The yield curve is one thing we follow carefully.”

“Again, based on the assessment of all the data, we still think it’s a positive outlook.”

The yield curve inverted for less than 48 hours before widening even further.

Last month, at the height of the media push for a recession, which surrounded the temporary inverted yield curve, former Fed Chair Janet Yellen argued many factors were impacting the yield curve. She added media pundits were not considering those factors, which suggest prior correlations are not historically comparable.

Ultimately, Chairman Powell said the Federal Reserve wanted to keep their monetary powder dry until there was a real risk of a U.S. recession.

He also stressed the strength of consumer spending, which has been evident in the U.S. retail sales numbers. The advance estimate for August doubled the consensus forecast. Retail sales are now 4.1% (±0.7%) higher than in August 2018.

U.S. retail sales have exceeded $500 billion for 8 straight months. It exceeded the threshold for another 7 consecutive months before it dipped to $499.9 billion in December 2018, likely due to an early Thanksgiving.

Chairman Powell described the labor market as strong and said spending on housing was “picking up” from the first half. Indeed, new residential construction statistics for August showed housing starts and building permits both crushing their respective forecasts.

Housing starts gained 12.3% (±10.2%) from the prior month and posted a 6.6% (±11.6%) increase from August 2018. Building permits gained 7.7% (±1.2%) from the prior month and 12.0% (±1.6%) from August 2018.

Fed Monetary Policy Vote

There was a deep division at the Federal Reserve Open Market Committee (FOMC) regarding the rate cut.

Fed Chair Jerome H. Powell voted for the monetary policy action and was joined by Chair, John C. Williams, Vice Chair; Michelle W. Bowman; Lael Brainard; Richard H. Clarida; Charles L. Evans; and Randal K. Quarles.

Voting against the action were James Bullard, who preferred at this meeting to lower the target range for the federal funds rate to 1-1/2 to 1-3/4%; and Esther L. George and Eric S. Rosengren, who preferred to maintain the target range at 2% to 2-1/4%.

Federal Reserve Chairman Jerome Powell shot down

New Residential Construction Far Stronger than Expected, Reflecting Builder Confidence

The U.S. Census Bureau reported stronger than expected new residential construction statistics for August, with housing starts and building permits both beating the forecasts. The report is released jointly with the U.S. Department of Housing and Urban Development (HUD).

Housing Starts

Privately‐owned housing starts came in at a seasonally adjusted annual rate of 1,364,000 in August. That’s a 12.3% (±10.2%) gain from the upwardly revised July estimate of 1,215,000 and a 6.6% (±11.6%)* increase from the August 2018 rate of 1,279,000.

Forecasts for housing starts ranged from a low of 1.209 million to a high of 1.275 million. The consensus forecast was 1.251 million.

Single‐family housing starts came in at a rate of 919,000 in August, which is 4.4% (±10.3%)* higher than the revised July figure of 880,000. The rate for units in buildings with five units or more was 424,000.

Building Permits

Privately‐owned housing units authorized by building permits came in at a seasonally adjusted annual rate of 1,419,000. That’s a 7.7% (±1.2%) gain from the revised July rate of 1,317,000 and a 12.0% (±1.6%) gain from the August 2018 rate of 1,267,000.

Forecasts for building permits ranged from a low of 1.274 million to a high of 1.336 million. The consensus forecast was 1.300 million.

Single‐family authorizations came in at a rate of 866,000, or 4.5% (±0.8%) higher than the revised July rate of 829,000. Authorizations of units in buildings with five units or more came in at a rate of 509,000.

Housing Completions

Privately‐owned housing completions in August were at a seasonally adjusted annual rate of 1,294,000. This is 2.4% (±11.5%)* above the revised July estimate of 1,264,000 and is 5.0% (±11.2%)* above the August 2018 rate of 1,232,000.

There is no consensus forecast for housing completions.

Single‐family housing completions in August were at a rate of 945,000, which is a 3.7% (±10.5%)* gain from the revised rate of 911,000 in July. The rate for units in buildings with five units or more was 338,000.

Previewing Next Month

On Tuesday, the National Association of Home Builders/Wells Fargo Housing Market Index (HMI) showed builder confidence hit the highest level for 2019 in September.

Homebuilder sentiment has held in the mid- to upper 60s since May, though housing starts and the new residential construction report were only inching marginally higher.

The 68 reading for September matched the highest level since last October.

While this new residential construction report lags the index by a month, the HMI for September bodes well for the housing report covering September.

*The 90 percent confidence interval includes zero. In such cases, there is insufficient statistical evidence to conclude that the actual change is different from zero

The U.S. Census Bureau reported strong new

Prosecutors Allege Buck Injected Drugs in Exchange for Sexual Fetishes

Hillary Clinton, left, and Democratic donor Ed Buck, right.

Democratic donor Ed Buck has been arrested and charged with operating a drug den inside his West Hollywood home. He is currently a major donor to Rep. Ted Lieu, D-Calif., Democratic Gov. Gavin Newsom and was a top donor to Hillary Clinton in 2016.

Mr. Buck last made headlines after two black men died from overdoses 18 months apart inside his home. However, a third man reportedly suffered an overdose last week and survived.

In July 2017, Gemmel Moore, a young African American man, was found naked on a mattress in the living room and dead of a drug overdose. Drug paraphernalia was found all over the room, according to authorities.

Timothy Dean, 55, suffered a methamphetamine overdose eighteen months later.

No charges were announced in those cases, raising objections from conservative activists and online social media personalities such as Mike Cernovich.

Mr. Buck has now been charged with three counts of battery and is accused of injecting the alleged third victim with methamphetamine on September 11, The Los Angeles Times reported.

Prosecutors allege Mr. Buck used his position of power to manipulate his victims into participating in his sexual fetishes.

“These fetishes include supplying and personally administering dangerously large doses of narcotics to his victims,” the prosecutors wrote, according to court papers obtained the Times.

KABC-TV Los Angeles reported prosecutors are seeking a $4 million bail. Mr. Buck faces up to five years and eight months in state prison if convicted and is due in court on Wednesday.

Democratic donor Ed Buck has been arrested

Lewandowski Sets Himself Up for New Hampshire Senate Bid

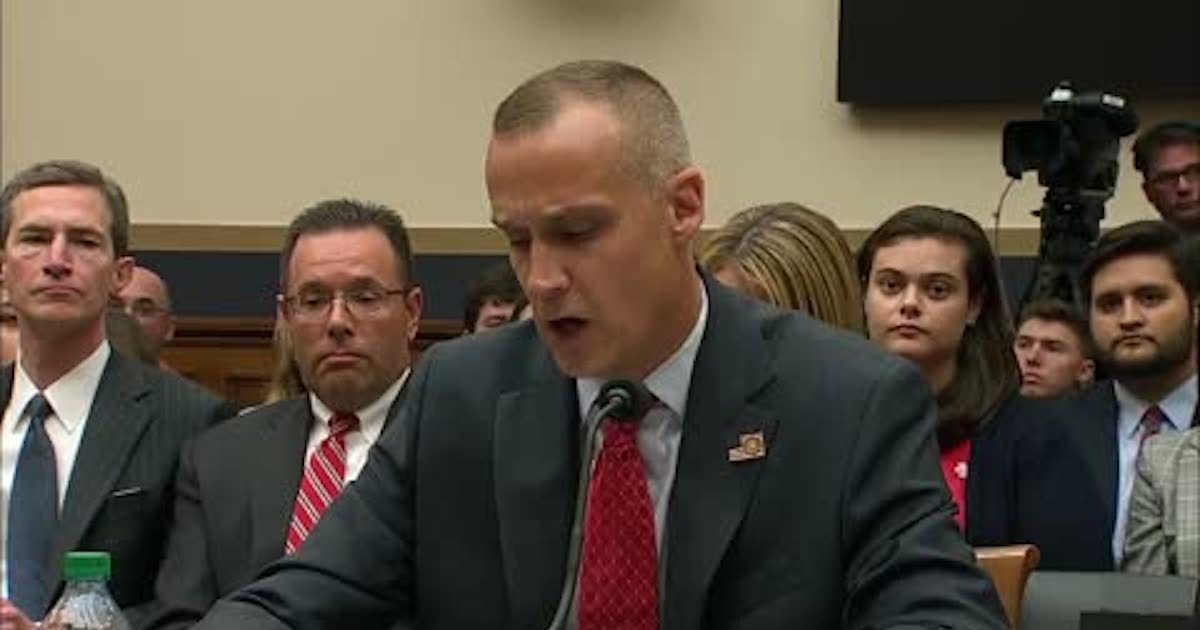
Corey Lewandowski, the former campaign manager for Donald Trump and expected candidates for U.S. Senate in New Hampshire, brought his A game to the Democrats’ first quasi impeachment hearing on Tuesday.

He slammed “Trump haters” and House Judiciary Committee Democrats for hauling him before their panel for an impeachment hearing, which The Hill and The New York Post both described as one that “quickly descended into chaos.”

“Sadly, the country spent over three years and 40 million taxpayer dollars on these investigations,” Mr. Lewandowski said in his opening statement. “It is now clear the investigation was populated by many Trump haters who had their own agenda — to try and take down a duly-elected President of the United States.”

Mr. Lewandowski, who never had an official role at the White House, was the first witness brought before the committee led by Chairman Jerry Nadler, D-N.Y., since members voted to define the scope of their impeachment inquiry.

The appearance was somewhat of an audition for the former Trump campaign manager, who is widely expected to run for U.S. Senate in New Hampshire. During the hearing, he tweeted the launch of a new website “to help a potential senate run.”

Repackaging Impeachment, Again

Rep. Doug Collins, R-Ga., the Ranking Member of the Judiciary Committee, opened up the hearing for the Republican side. He criticized Democrats for wasting the committee’s time on matters that have been investigated ad nauseam.

“I’ve never seen a majority so amazed with packaging in all my life. You know why? Because they can’t sell what’s inside!” Rep. Collins lamented. “They can’t sell the product. So, they keep packaging it differently.”

Lewandowski’s Emails

In another moment, Mr. Lewandowski took a stab at Hillary Clinton, who violated federal records rules and deleted emails under subpoena.

“I also received hundreds of thousands of emails, some days with as many as 1,000 emails — and unlike Hillary Clinton, I don’t think I ever deleted any of those.”

Lewandowski Mocks President Swalwell

In an exchange with Rep. Eric Swalwell, D-Calif., he mocked the failed 2020 Democratic candidate by referring to him as “President Swalwell.”

Rep. Sheila Jackson Lee’s, D-Texas, and Mr. Lewandowski got into a back-and-forth over who would read excerpts from the Mueller report. Democrats repeatedly showed sections on large screens in the hearing room.

“You’re welcome to read it, Congresswoman,” he said. “Don’t ask me a question I won’t answer.”

The sparring continued.

“This is the House Judiciary, not a house party,” Rep. Jackson Lee told Mr. Lewandowski in one response.

It Was Just A Rant

At the end of her five-minute time allotment, Rep. Jackson Lee accused Mr. Lewandowski of doing the president’s “dirty work in secret because he knew it was wrong.”

Chairman Nadler told Mr. Lewandowski he could answer the congresswoman’s question even though her time had elapsed before she had asked one.

“I don’t believe there was a question,” Mr. Lewandowski responded. “It was just a rant.”

Chairman Nadler shut down Rep. Jackson Lee, who tried to re-engage with the witness, clearly aware of the bad optics.

Corey Lewandowski, the former campaign manager for

Housing Market Index (HMI) Highest Since October 2018

The National Association of Home Builders/Wells Fargo Housing Market Index (HMI) showed builder confidence in September hit the highest level for 2019. Homebuilder sentiment has held in the mid- to upper 60s since May and September’s reading matches the highest level since last October.

“Low interest rates and solid demand continue to fuel builders’ sentiments even as they continue to grapple with ongoing supply-side challenges that hinder housing affordability, including a shortage of lots and labor,” said NAHB Chairman Greg Ugalde, a home builder and developer from Torrington, Conn.

The NAHB/Wells Fargo & Co (WFC) Housing Market Index (HMI) is derived from data collected for over 30 years. It gauges builder confidence in the market for current single-family home sales and sales expectations for the next six months as “good,” “fair” or “poor.”

The survey also asks builders to rate traffic of prospective buyers as “high to very high,” “average” or “low to very low.” A reading above 50 indicates that more builders view conditions as good than poor.

“Solid household formations and attractive mortgage rates are contributing to a positive builder outlook,” said NAHB Chief Economist Robert Dietz. “However, builders are expressing growing concerns regarding uncertainty stemming from the trade dispute with China.”

The HMI component gauging current sales conditions rose another 2 points to 75 and the component for traffic of prospective buyers held firm at 50. The measure charting sales expectations in the next six months fell 1 point to a still elevated reading of 70.

Looking at the 3-month moving averages for regional HMI scores, the Northeast and West each posted 2-points gain to 59 and 75, respectively. The South inched up 1 point higher to 70, while the Midwest was unchanged at 57.

“NAHB’s Home Building Geography Index indicates that the slowdown in the manufacturing sector is holding back home construction in some parts of the nation,” Mr. Dietz also said, adding “there is growth in rural and exurban areas.”

The Federal Reserve earlier Tuesday reported industrial production rose 200% more than the forecasts, with manufacturing posting a strong rebound in August from July and the first quarter of 2019.

Methodology

The HMI is a weighted average of separate diffusion indices for these three key single-family series. The first two series are rated on a scale of Good, Fair and Poor and the last is rated on a scale of High/Very High, Average, and Low/Very Low. A diffusion index is calculated for each series by applying the formula “(Good-Poor+100)/2” to the present and future sales series and “(High/Very High – Low/Very Low + 100)/2” to the traffic series. Each resulting index is then seasonally adjusted and weighted to produce the HMI.

Based on this calculation, the HMI can range between 0 and 100.

The National Association of Home Builders/Wells Fargo

Manufacturing Production More than Recovers Losses in July

The Federal Reserve reported industrial production rose 0.6% in August after declining 0.1% in July, easily beating the forecast range and consensus. Forecasts for the total index ranged from a low of -0.5% to a high of 0.6%.

The consensus forecast was just 0.2%.

Manufacturing production more than recovered from the losses in July, gaining 0.5%. Forecasts for the manufacturing component ranged from a low of -1.0% to a high of 0.3%.

The consensus forecast was 0.1%.

Factory output has risen just 0.2% per month over the past 4 months. But it fell 0.5% per month during the first 4 months of the year, indicating the slowdown in manufacturing might not last and, indeed, could be over.

The indexes for utilities and mining rose 0.6% and 1.4% in August, respectively.

For mining output, the Board of Governors of the Federal Reserve System said the dip in July was due to a cutback in oil extraction in the Gulf of Mexico in response to Hurricane Barry. For utilities, both electric and natural gas utilities posted gains in August.

At 109.9% of its 2012 average, total industrial production was 0.4% higher than it was a year earlier.

Capacity utilization for the industrial sector rose 0.4% in August to 77.9%, a rate 1.9% below its long-run (1972–2018) average. Forecasts for the Capacity Utilization Rate ranged from a low of 77.3% to a high of 77.7%.

The consensus forecast was 77.6%.

You Might Also Like

The Federal Reserve reported industrial production rose

Optimism Wanes in New York Fed Manufacturing

The New York Federal Reserve Empire State Manufacturing Survey was little changed for September, edging down nearly 3 points to miss the consensus forecast. The general activity came in at 2.0 as expectations offset an increase in new orders.

Twenty-seven percent (27%) of respondents reported that conditions had improved over the month, while 25% reported conditions had worsened.

New orders fell 3.5 points though remained positive and the shipments index fell 4 points to 5.8, the lowest level in almost 3 years.

Forecasts for September

The month of August showed moderate growth for the Empire State Manufacturing Survey. But the rebound to 4.8 was led by a gain in new orders that indicated a positive headline for September.

Still, the forecasts ranged from a low of -1.0 to a high of 5.4. The consensus forecast for September called for little change at 4.9.

Employment

The bright spot for September came from employment, which had been negative for three consecutive months. The number of employees index increased to 9.7, and the average workweek index came in at 1.7.

Prices increased at a faster pace. The prices paid index moved up 6 points to 29.4, and the prices received index rose 5 points to 9.2.

Future Optimism

The index for future business conditions fell twelve points to 13.7. The capital expenditures index tanked 19 points to 4.6, the lowest level in 3 years. The technology spending index fell to a multi-year low at 6.5.

About the Empire State Manufacturing Survey

The Second Federal Reserve District includes New York State, Northern New Jersey, Southwestern Connecticut, Puerto Rico, and the U.S. Virgin Islands.

However, the Empire State Manufacturing Survey is sent on the first day of each month to the same pool of about 200 manufacturing executives in New York State, typically the president or CEO. Roughly 100 responses are collected. Most are completed by the tenth, although surveys are accepted until the fifteenth.

The New York Federal Reserve Empire State

Heir to al-Qaeda Killed Near Afghanistan-Pakistan Border

Hamza bin Laden. (Photo: Courtesy of Central Intelligence Agency)

The White House confirmed Hamza bin Laden, the son of al-Qaida founder Osama bin Laden, was killed in a U.S. counterterrorism operation.

“Hamza bin Laden, the high-ranking al-Qaeda member and son of Usama bin Laden, was killed in a United States counterterrorism operation in the Afghanistan/Pakistan region,” the White House said in a statement on Satursday.

“The loss of Hamza bin Laden not only deprives al-Qaida of importance leadership skills and the symbolic connection to his father, but undermines important operational activities of the group. Hamza bin Laden was responsible for planning and dealing with various terror groups.”

In early August, multiple news outlets citing unnamed U.S. intelligence officials reported the death of the terror heir as the result of an air strike.

Bin Laden, believed to be 30-years-old, was designated by the U.S. State Department roughly two years ago. As recently as February 2019, the U.S. government posted $1,000,000 reward for information leading to his capture. That’s the equivalent of £825,000.

Bin Laden married the daughter of Abdullah Ahmed Abdullah, also known as (A.K.A.) Abu Muhammad al-Masri, who was indicted for his alleged involvement in the 1998 bombings of the U.S. embassies in Tanzania and Kenya.

In 2011, U.S. Navy SEALS killed his father, Osama bin Laden, who had been hiding in a compound in Abbottabad, Pakistan. U.S. forces had been hunting for him since the attacks September 11, 2001, in which nearly 3,000 people were killed.

As a result of the raid on the compound, the U.S. seized a treasure trove of documents indicating Hamza bin Laden was being groomed to take over for his father as the leader of al-Qaeda.

However, Ayman al-Zawahiri has led al-Qaeda since June 2011. Bin Laden served as a go-between for al-Qaeda and like-minded Islamic terror groups.

In recent years, al-Qaeda, which translates from Arabic to English as “the Base,” released 11 audio messages in which he called for attacks on the U.S. to avenge his father’s death. He routinely threatened the U.S. and encouraged jihadists to fight in Syria.

In his last public statement in March 2018, he called on Muslims in the Arabian Peninsula to revolt. Later that month, Saudi Arabia revoked his citizenship.

The news comes only three days after the U.S. remembered the 18th anniversary of the attacks.

Hamza bin Laden, the heir and son

Sales Pickup Pace, Pointing to Needed Build in Business Inventories

The U.S. Census Bureau reported business inventories gained 0.4% (±0.1%) to $2,042.6 billion in July, edging out the forecast in a positive sign for third-quarter (Q3) gross domestic product (GDP). Inventories were up 4.8% (±0.4%) from July 2018.

Forecasts for July ranged from a low of 0.1% to a high of 0.4%. The consensus forecast was 0.3%. Estimates are adjusted for seasonal variations but not for price changes.

Business sales were estimated at $1,462.9 billion, up 0.3% (±0.1%) in July from June and 1.3% (±0.3%) from July 2018.

The total business inventories/sales ratio based on seasonally adjusted data at the end of July was 1.40. The July 2018 ratio was 1.35.

You Might Also Like

Business inventories gained 0.4% (±0.1%) to $2,042.6

Retail Sales Gain 0.4% in August, 4.1% Year-Over-Year; Revised Higher for June and July

The U.S. Census Bureau reported advance retail sales were $526.1 billion, stronger-than-expected increase of 0.4% (±0.5%)* from July. Retail sales are now 4.1% (±0.7%) higher than in August 2018.

Estimates are adjusted for seasonal variation and holiday and trading-day differences, but not for price changes. Forecasts for August ranged from a low of -0.1% to a high of 0.4%. The consensus forecast was 0.2%.

Retail sales have exceeded $500 billion for the eight straight month. If not for a dip just below in December 2018, it would be 16 straight months. They had hit that threshold for 7 straight months prior.

Retail trade sales were up 0.6% (±0.5%) from June 2019 and 4.6% (±0.7%) higher than last year. Nonstore retailers were up 16.0% (±1.4%) from August 2018, and motor vehicles and parts dealers were up 6.8% (±1.9%) from last year.

Previous Retail Sales Revised Higher

Total sales for the June 2019 through August 2019 period were up 3.7% (±0.5%) from the same period a year ago. The June 2019 to July 2019 percent change was revised from up 0.7% (±0.5%) to up 0.8% (±0.1%).

For retail sales less auto sales, forecasts ranged from a low of -0.2% to a high of 0.4%. The consensus forecast was 0.2%.

For retail sales less auto sales and gas, forecasts ranged from a low of 0.0% to a high of 0.6%. The consensus forecast was 0.3%.

*The 90 percent confidence interval includes zero. There is insufficient statistical evidence to conclude that the actual change is different from zero.

You Might Also Like

The U.S. Census Bureau reported advance retail

People's Pundit Daily
You have %%pigeonMeterAvailable%% free %%pigeonCopyPage%% remaining this month. Get unlimited access and support reader-funded, independent data journalism.

Start a 14-day free trial now. Pay later!

Start Trial