Secession in the Modern World: Should Sardinia Leave Italy and Join Switzerland?
Two men from Sardinia want to liberate their island from Italian rule and be adopted by someplace else — Switzerland. (PHOTO: Moment Open/Getty Images)
What’s the best country in the world? My emotional response is that the United States belongs in the top spot. But a more dispassionate analysis suggests that Switzerland is more deserving of the honor.
 It has the 4th-freest economy according to the most recent rankings from Economic Freedom of the World, eight spots above the United States. And it is ranked #2 in the Human Freedom Index, 18 spots higher than America. There are several specific reasons why Switzerland is a good role model.
- It still maintains real federalism, and government is constrained when it takes place at the canton and municipal level.
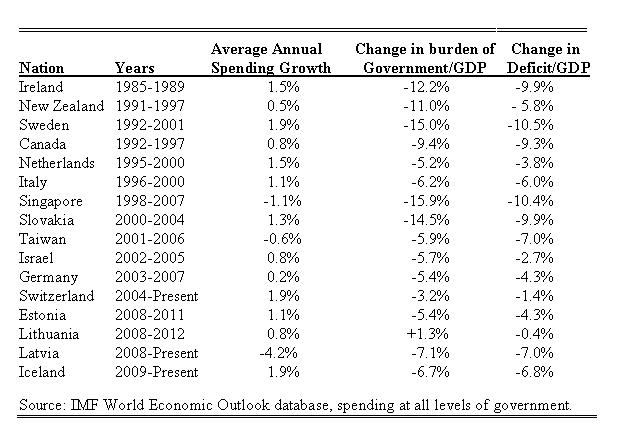
- It has a lower burden of government spending, in part because of a very successful limit on yearly spending increases.
- The nation’s financial privacy laws, though weakened by foreign pressure, still provide some protection for human rights.
- There is a strong tradition of gun ownership.
Perhaps most important, the Swiss people are eminently sensible, as seen by their votes in favor of a spending cap and against class-warfare taxation, minimum-wage mandates, single-payer healthcare, and the death tax.
I’m not sure I would trust my fellow Americans to show similarly sound judgement. So, it’s surely true that there are lots of reasons to admire Switzerland. Indeed, it’s such an attractive country that many people in Sardinia want to secede from Italy and have their island become a Swiss canton.
Here are some passages from a report in the Wall Street Journal.
“In Sardinia, people want to be Swiss.” Welcome to “Canton Marittimo,” or “Canton of the Sea,” a bid by Mr. Caruso, a 51-year-old dentist from Sardinia, and his comrade Enrico Napoleone, a car dealer there, to liberate Sardinia from Italy and tether it to Switzerland. …With a population of 1.5 million, the island, which lies between Italy and Spain, is today home to more than 10 parties calling for secession from Rome, emphasizing a culture, dialect, and history distinct from Italy’s mainland. …Mr. Caruso says…“Switzerland is the ideal nation to help us secure our culture and traditions.” … “Most of the local population would go for it, starting tomorrow,” said Matteo Colaone, a spokesman for Domà Nunch, a separatist group in the Italian regions surrounding Milan.
And what do the Swiss think about this idea? At least one lawmaker likes the idea of adding cantons, though the government’s official position is not very welcoming.
In 2010, a member of Swiss parliament named Dominique Baettig proposed amending the constitution to aid regions in neighboring countries that want to become new cantons. Switzerland’s executive branch swiftly condemned it as “an unfriendly political act.” …There is little evidence the Swiss would want to adopt a rocky island that has many more sheep than people and per-capita economic output just one fourth that of Switzerland’s.
Here’s a video report on the topic from the WSJ.
In any event, it’s easy to understand why Sardinians are anxious to leave Italy and become part of Switzerland. Here are some excerpts from a story in the U.K.-based Guardian.
“We think of Switzerland as a good teacher who could lead us on a path of excellence.” As the 27th canton, Sardinia, so goes the argument, would bring the Swiss its miles of stunning coastline and untapped economic potential. Sardinia could retain considerable autonomy, while also reaping the benefits of direct democracy, administrative efficiency and economic wealth.
Whereas staying in Italy means endless statism.
…their frustrations with inefficient public spending, complex layers of decision-making and intimidating bureaucracy can be heard throughout the country. …being a small businessman in Italy was “a continuous battle”. “It is fighting every day with a problem that the administration, the bureaucracy, creates instead of solves,” he said.
And while the Swiss government doesn’t seem overly excited about adopting Sardinia, ordinary Swiss citizens seem to like the idea.
An online poll of 4,000 people asking, in German, “should we accept Sardinia?” produced a 93% yes vote.
I suspect that an actual referendum in Switzerland wouldn’t be that lopsided, and the final result would probably depend on whether Swiss voters thought Sardinians were simply seeking good policy or whether they were looking for big handouts (Switzerland does have some redistribution from rich cantons to those with more modest incomes).
The bottom line is that there’s scholarly evidence suggesting that supporters of decentralization, self-determination, and limited government should favor the ability of regions to either declare independence or choose to join neighboring countries (assuming there’s a mutual desire for union).
 That why I think secession or radical decentralization is/was the right approach inUkraine, Belgium, and Scotland.
And as Walter Williams points out, secession can be peaceful, such as when Norway left Sweden early last century.
So I hope Sardinia moves forward.
Yes, it would be best for them to become part of Switzerland (and there already isan Italian-speaking canton). But even if the Swiss ultimately aren’t interested, the Sardinians at least would have a chance to escape Italy’s dysfunctional economic policies if they became independent.
P.S. The seven villages of Liechtenstein have the right to secede.
P.P.S. On a lighter note, here’s what would happen if the American right and left decided to secede from each other.
P.P.S. In our final postscript, let’s look at some fresh data about Switzerland.
Check out this chart (h/t: Constantin Gurdgiev) looking at how growth rates have changed in various European nations. As you can see, the 2002-2014 period has been grim for all nations compared to the years between 1980-2001. But Switzerland has had the smallest decline.
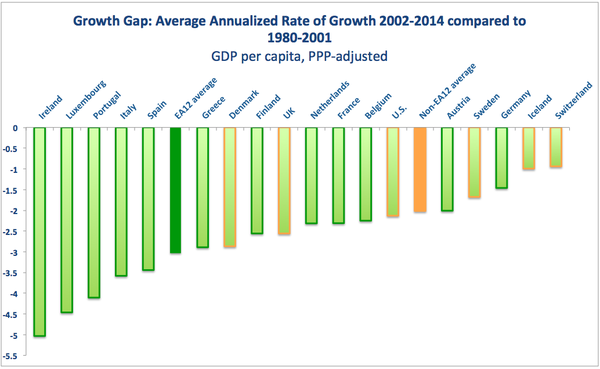
Annualized rate of GDP growth 2002-2014 vs 1980-2001.
By the way, the left is always arguing that high tax burdens are necessary to help the poor. But as you can see from this chart (h/t: Fabian Wallen), every single income group is better off in low-tax Switzerland than high-tax Sweden.
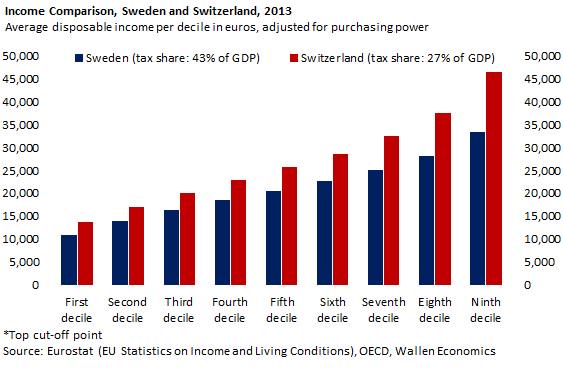
2013 income comparison, Sweden vs. Switzerland.
In other words, big government is bad news for everyone (other than insiders), but it’s especially bad for poor people. Bono realizes that capitalism is the right model for upward mobility. Now let’s hope Pope Francis learns the same lesson.
[mybooktable book=”global-tax-revolution-the-rise-of-tax-competition-and-the-battle-to-defend-it” display=”summary” buybutton_shadowbox=”true”]
When looking at the economic freedom data,