Widget Image
Follow PPD Social Media
Monday, January 13, 2025
HomeStandard Blog Whole Post (Page 9)

Opium Production in Afghanistan Hit a High 9,000 Metric Tons for 2017

Growers in Eastern Afghanistan harvest opium from ripe papaver somniferum, more commonly known as the Opium poppy. (Photo: AdobeStock)

The longest war in U.S. history began almost immediately after the attacks on September 11, 2001. But after nearly 19 years — deploying at peak more than 100,000 troops, sacrificing the lives of nearly 2,400 U.S. soldiers, spending more than $1 trillion on military operations, more than $100 billion on “nation-building,” or funding and training an army of 350,000 Afghan soldiers — opium production in Afghanistan remains robust.

In 2001, Afghanistan produced approximately 180 metric tons of opium. Only one year after the U.S. invasion, opium production swelled to more than 3,000 metric tons a year.

The U.N. Office on Drugs and Crime (UNODC) World Drug Report estimates Afghanistan opium production at 6,400 metric tons for 2019. That’s sufficient to manufacture 472 to 722 tons of heroin, unchanged from production levels in 2018. The annual opium survey previously found a record high 9,000 metric tons for 2017, a gain of 87% compared to 2016.

Prior to 2001, Afghanistan had already been the world’s leading illicit opium producer, having claimed that title since 1992. Former Taliban leader Mullah Mohammed Omar declared growing papaver somniferum — more commonly known as opium poppies — to be un-Islamic in July of 2000.

The result was one of the world’s most successful anti-drug campaigns ever waged. That’s no small part due to how the Taliban enforced the ban on poppy farming via threats, forced eradication and public punishments.

But Afghanistan saw a 99% reduction in the area of opium poppy farming in Taliban-controlled areas, which represented roughly 75% of the world’s supply of heroin at the time.

President Donald J. Trump has long-criticized continued U.S. involvement in the Middle East and has taken numerous steps to make good on his campaign promise to get America out of “endless wars.”

As a candidate, he campaigned on prioritizing illicit drug trades over foreign intervention. In 2018, he declared the U.S. would withdraw military troops from Syria, and he did so without the consent of his more hawkish advisors.

On Wednesday, the commander of U.S. Central Command said the U.S. will pull thousands of troops out of Iraq and Afghanistan by November.

Marine General Frank McKenzie said the troop withdrawal in Iraq — from about 5,200 to 3,000 — is possible because the administration decimated the Islamic State. U.S. troop levels in Afghanistan will be reduced from 8,600 to 4,500. The current troop presence level was reduced in June.

“At 4,500 we’re still going to be able to accomplish the core tasks that we want to accomplish,” General McKenzie said. “The U.S. decision is a clear demonstration of our continued commitment to the ultimate goal, which is an Iraqi security force that is capable of preventing an ISIS resurgence and of securing Iraq’s sovereignty without external assistance.”

“The journey has been difficult, the sacrifice has been great, but the progress has been significant.”

Afghanistan opium production remains robust at 6,400

Consumer Prices Have Risen Solidly Since June, But Gains Are Healthy Given Pre-Pandemic Inflation Weakness

Consumer Price Index (CPI) graphic concept. (Photo: AdobeStock)

Washington, D.C. (PPD) — The Consumer Price Index (CPI) rose a seasonally-adjusted 0.4% in August after gaining 0.6% in July and June, the U.S. Bureau of Labor Statistics reported. Consumer prices have now risen 1.3% year-over-year, also on a seasonally-adjusted basis.

Forecasts for the headline monthly percentage change for the CPI ranged from a low of 0.1% to a high of 0.4%. The consensus forecast was 0.3%. Forecasts for the annual percentage change ranged from a low of 1.1% to a high of 1.4%. The consensus forecast was 1.2%.

The CPI for all items less food and energy rose sharply by 0.4% in August after rising 0.6% in July. Used cars and trucks accounted for over 40% of the increase. Forecasts ranged from a low of 0.1% to a high of 0.4%. The consensus forecast was 0.2%.

The CPI for all items less food and energy has risen 1.7% year-over-year. Forecasts ranged from a low of 1.5% to a high of 1.7%. The consensus forecast was 1.6%.

The Consumer Price Index (CPI) rose 0.4%

Weekly Jobless Claims, Long-Term Unemployment Stumped after Sharp Decline

U.S. initial jobless claims graph on a tablet screen. (Photo: AdobeStock)

Washington, D.C. (PPD) — The U.S. Labor Department (DOL) reported initial jobless claims held at a seasonally-adjusted 884,000 for the week ending September 5. The previous week was upwardly revised slightly by 3,000 from 881,000.

Forecasts ranged from a low of 795,000 to a high of 915,000. The consensus forecast was 828,000.

The 4-week moving average fell again, down 21,750 to 970,750. The previous week’s average was revised up by 750 from 991,750 to 992,500.

Lagging Jobless Claims Data

The advance seasonally adjusted insured unemployment rate fell to single digits for the week ending August 15 at 9.9%, and fell another 0.8 to 9.1% for August 22. But it ticked higher 0.1 to 9.2% for the week ending August 29.

The insured unemployment rate hit the first high of the current crisis at 8.2% for the week ending April 4. The all-time high prior to that was 7.0%, recorded in May of 1975. On April 11, it rose to 11.0% and 12.4% on April 25.

Under the Trump Administration, this rate had fallen to an all-time low 1.1% and remained at 1.2% just weeks ago, as recently as March 14. But that was before coronavirus (COVID-19) mitigation efforts.

The advance number for seasonally adjusted insured unemployment during the week ending August 29 rose 93,000 to 13,385,000. The previous week was revised up 38,000 from 13,254,000 to 13,292,000.

The 4-week moving average was 13,982,000, a decline of 523,750. The previous week was revised up by 9,500 from 14,496,250 to 14,505,750.

As the Bureau of Labor Statistics (BLS) stated in the report on job openings and labor turnover (JOLTS) released on Wednesday, the ongoing effort to curtail the resumption of economic activity following the pandemic is hurting the recovery in the labor market. Still, the number of job openings rose significantly more than expected in July, up to 6.6 million from an upwardly revised 6.0 million

The highest insured unemployment rates in the week ending August 22 were in Hawaii (20.3), Puerto Rico (16.7), Nevada (16.0), New York (14.9), California (14.8), Connecticut (14.7), Louisiana (13.2), the Virgin Islands (12.6), Georgia (12.2), and District of Columbia (11.5).

The largest increases in initial claims for the week ending August 29 were in California (+22,647), Texas (+4,521), Louisiana (+3,662), Tennessee (+1,288), and Missouri (+1,226), while the largest decreases were in Florida (-6,057), Georgia (-5,485), Pennsylvania (-2,627), Wisconsin (-1,422), and Michigan (-1,159).

Extended Benefits were available in all 50 states, Puerto Rico and D.C. during the week ending August 15.

Initial jobless claims held steady at a

Man reading newspaper with the headline Job Market. (Photo: AdobeStock)

Washington, D.C. (PPD) — The number of job openings rose significantly more than expected in July, up to 6.6 million from an upwardly revised 6.0 million, the U.S. Bureau of Labor Statistics (BLS) reported. While hires fell to 5.8 million in July from a historically high level around 7.0 million over the last two months, total separations were largely unchanged at 5.0 million.

Forecasts for job openings ranged from a low of 5.8 million to a high of 6.0 million. The consensus forecast was 5.95 million.

Within separations, the quits rate rose to 2.1% while the layoffs and discharges rate decreased to 1.2%. The BLS JOLTS report cites changes in the labor market being reflective of an ongoing effort to curtail the resumption of economic activity following the coronavirus (COVID-19) pandemic.

Hires

The number and rate of job openings gained +617,000 and 4.5%, respectively. The largest gain in job openings occurred in the South and Midwest, stemming from retail trade (+172,000), health care and social assistance (+146,000), and construction (+90,000).

Hires rose in the federal government (+33,000) largely due to hiring for the U.S. Census. Hires also gained in real estate and rental and leasing (+26,000). As People’s Pundit Daily (PPD) previously reported, the U.S. housing market is booming and well-positioned to lead the economic recovery.

Separations

While there was an uptick in quits, layoffs declined in July. That indicates jobs are available for those who want them, particularly if they are qualified.

The number and rate of quits rose to 2.9 million (+344,000) and 2.1%, respectively. That was driven by retail trade (+152,000), professional and business services (+98,000), and state and local government education (+35,000).

The number and rate of layoffs and discharges fell to 1.7 million (-274,000) and 1.2%, respectively. Layoffs and discharges declined in durable goods manufacturing (-40,000), transportation, warehousing, and utilities (-40,000), and wholesale trade (-21,000).

The number of job openings rose significantly

Job Creation Displaying ‘Unprecedented’ Recovery Post-Shutdown

A team of millennial business owners collaborating on an online project using a touchpad tablet in a modern office space. (Photo: AdobeStock/AYAimages)

Washington, D.C. (PPD) — The NFIB Small Business Optimism Index bounced back to exceed expectations and the 46-year average in August, gaining 1.6 points to 100.6. Hiring plans improved and 7 of the 10 Index components improved, while only two declined and one was unchanged.

Forecasts ranged from a low of 97.0 to a high of 100.0. The consensus forecast was 98.9.

“Small businesses are working hard to recover from the state shutdowns and effects of COVID-19,” said NFIB Chief Economist Bill Dunkelberg. “We are seeing areas of improvement in the small business economy, as job openings and plans to hire are increasing, but many small businesses are still struggling and are uncertain about what the future will hold.”

The NFIB Uncertainty Index increased two points in August to 90, the second-highest reading since 2017. The all-time record high for the Uncertainty Index was 100 measured in November 2016.

Hiring plans rose 3 points from 18 to 21 in August and job creation has now shown an “unprecedented” pace of recovery. Last week, the U.S. Bureau of Labor Statistics (BLS) monthly jobs report found the U.S. economy added 1.4 million jobs in August and the unemployment rate fell more than expected to 8.4%.

As People’s Pundit Daily (PPD) previously reported, the broader alternative measure of unemployment U-6 fell significantly to 14.2% in August, and has fallen 8.6% over the last four months. Comparing recoveries, the U-6 rate has fallen more in four months post-pandemic shutdown under the Trump-Pence administration than it did in more than four years post-Great Recession under Obama-Biden.

Twenty-one percent (21%) of small business owners cited “finding qualified labor” as their top business problem, including 41% in construction. While that could translate to slowing new home production, as NFIB stated, new residential construction has been booming in 2020 despite the pandemic.

The NFIB Small Business Optimism Index bounced

Comparing Job Market Recoveries, Trump-Pence Far Surpassing Obama-Biden

A newspaper with the headline "Job Market". (Photo: AdobeStock)
A newspaper with the headline “Job Market”. (Photo: AdobeStock)

Former Vice President Joe Biden is claiming he could “Build Back Better” than President Donald Trump after the economic shutdown to mitigate the spread of the coronavirus (COVID-19) pandemic, citing his record following the Great Recession. However, the U-6 unemployment rate has fallen more in four months post-shutdown under the Trump-Pence administration than it did in four years post-Great Recession under Obama-Biden.

The U.S. Bureau of Labor Statistics (BLS) monthly jobs report found the U.S. economy added 1.4 million jobs in August and the unemployment rate fell more than expected to 8.4%. While the increase in total nonfarm employment hit the consensus forecast, the decline in the employment rate far exceeded expectations.

Forecasts for the unemployment rate ranged from a low of 8.5% to a high of 10.4%. The consensus forecast was a far higher than reported 9.8%.

U-6 is an alternative measure of unemployment defined as the rate for total unemployed, plus all marginally attached workers and total employed part time for economic reasons as a percent of the total civilian labor force, plus all marginally attached workers. In August, the U-6 fell significantly to 14.2% and has fallen 8.6% over the last four months.

The U-6 rate hit an all-time high of 22.8% during shutdown in April. It climbed to the previous high of 17.1% in October 2009, after the Obama-Biden administration took office in January 2009. It remained around that level for an additional nine months after the Great Recession ended in the summer of 2009.

It fell briefly to 14.5% in March 2012 before increasing again over the course of that year. It wasn’t until the following year that the U-6 fell to or below 14.2%. In March 2013, it fell to 13.8% and rose again over the next few months. It finally began to fall consistently later that summer.

What took four years under the Obama-Biden administration, took only four months under the Trump-Pence administration. It is one of several data points suggesting the downturn was an artificial, rather than an organic recession.

Worth noting, the declines in the total civilian unemployment rate and the alternative measure U-6 rate were accompanied by declining labor force participation rates under Obama-Biden. The opposite is true of the declining unemployment rates under Trump-Pence, a period during which labor participation rates have risen.

As a result of BLS methodology, unemployment rate could decline if the labor force shrinks, meaning workers retire or give up on the American dream. Labor force participation was on a downward trend under Obama-Biden, which puts little to no upward pressure on wages.

When labor force participation and the equally important but less-cited employment-population ratio rise, and yet unemployment rates continue to fall even as people enter the labor force, it’s indicative of a far stronger labor market and wages rise.

The result was real wage growth for the first time since the Great Recession. Wages rose by 3% in the fourth quarter (Q4) 2018 for the first time since 2009. Wage growth on the 12-month met or exceeded 3% for consecutive months until that was interrupted for one month in May 2020, a result of the shutdown. Wages, which distorted due to employment fluctuations, have risen by 4.9%, 4.8% and 4.7% in June, July and August, respectively.

The U-6 unemployment rate has fallen more

Series with themes reflecting a certain billionaire politician who won the 2016 presidential election touting a very strong labor market. (Photo: AdobeStock)

Washington, D.C. (PPD) — The U.S. Bureau of Labor Statistics (BLS) monthly jobs report finds the U.S. economy added 1.4 million jobs in August and the unemployment rate fell more than expected to 8.4%.

Forecasts for total nonfarm employment ranged from a low of 435,000 to a high of 2,000,000. The consensus was 1,400,000. Forecasts for the unemployment rate ranged from a low of 8.5% to a high of 10.4%. The consensus forecast was 9.8%.

The labor force participation rate rose 0.3 to 61.7%, slightly beating the forecast. Forecasts ranged from a low of 61.5% to a high of 61.7%. The consensus forecast was 61.6%. The less-cited employment-population ratio rose by 1.4 to 56.5%.

The large employment fluctuations over the past several months — particularly in industries with lower-paid employees — have distorted recent trends in average hourly earnings, or wages. Nevertheless, workers’ wages rose at a faster pace than supervisory workers in August, a years-long trend under the current administration.

In August, average hourly earnings for all employees on private nonfarm payrolls rose by 11 cents to $29.47. Average hourly earnings of private-sector production and nonsupervisory employees increased by 18 cents to $24.81, following a decrease of 10 cents in the prior month.

Forecasts for 12-month wage growth ranged from a low 4.2% to a high of 4.6%. The consensus was 4.6%. Wage growth was 4.7% in August.

Revisions

The change in total nonfarm payroll employment for June was revised down by 10,000, from +4,791,000 to +4,781,000, and the change for July was revised down by 29,000, from +1,763,000 to +1,734,000. With these revisions, employment in June and July combined was 39,000 less than previously reported.

The monthly jobs report finds the U.S.

Weekly Jobless Claims, Long-Term Unemployment Tumble to Beat Expectations

U.S. initial jobless claims graph on a tablet screen. (Photo: AdobeStock)

Washington, D.C. (PPD) — The U.S. Labor Department (DOL) reported initial jobless claims fell 130,000 to a seasonally-adjusted 881,000 for the week ending August 29. The previous week was upwardly revised slightly by 5,000 from 1,006,000 to 1,011,000.

Forecasts ranged from a low of 910,000 to a high of 1,175,000. The consensus forecast was 958,000.

The 4-week moving average fell 77,500 to 991,750. The previous week’s average was revised up by 1,250 from 1,068,000 to 1,069,250.

Lagging Jobless Claims Data

The advance seasonally adjusted insured unemployment rate fell back to single digits for the week ending August 15 at 9.9%, and fell another 0.8 to 9.1% for August 22. The previous week was unrevised.

The insured unemployment rate hit the first high of the current crisis at 8.2% for the week ending April 4. The all-time high prior to that was 7.0%, recorded in May of 1975. On April 11, it rose to 11.0% and 12.4% on April 25.

Under the Trump Administration, this rate had fallen to an all-time low 1.1% and remained at 1.2% just weeks ago, as recently as March 14. But that was before coronavirus (COVID-19) mitigation efforts.

The advance number for seasonally adjusted insured unemployment during the week ending August 22 tumbled 1,238,000 to 13,254,000. The previous week’s level was downwardly revised by 43,000 from 14,535,000 to 14,492,000.

The 4-week moving average was 14,496,250, a decrease of 709,000 from the previous week’s revised average. The previous week’s average was revised down by 10,500 from 15,215,750 to 15,205,250.

Extended Benefits were available in all 50 states, Puerto Rico and D.C. during the week ending August 8. The total number of people claiming benefits in all programs for that same period was 29,224,546.

The highest insured unemployment rates in the week ending August 15 were in Hawaii (18.6), Nevada (16.4), California (16.3), Puerto Rico (16.1), New York (15.2), Connecticut (14.0), Louisiana (13.3), Georgia (12.6), the Virgin Islands (11.8), District of Columbia (11.7), and Massachusetts (11.7).

The largest increases in initial claims for the week ending August 22 were in California (+6,562), Illinois (+3,856), Pennsylvania (+1,926), Kansas (+1,061), and Rhode Island (+503), while the largest decreases were in Florida (-21,127), Texas (-9,248), New Jersey (-5,235), Virginia (-3,715), and North Carolina (-3,708).

Initial jobless claims fell 130,000 to a

Industry production 4.0 and technology concept, depicting factory production on a conveyor belt with factory operational workers in uniform. (Photo: AdobeStock)

Factory orders, or new orders for manufactured goods rose $27.8 billion or 6.4% to $466.1 billion in July, the U.S. Census Bureau reported. That’s the third straight month of gains and follows a stronger than expected and initially reported gain of 6.4% in June.

Forecasts for factory orders ranged from a low of 2.0% to a high of 10.4%. The consensus forecast was 6.0%.

Meanwhile, shipments have also been up for three consecutive months and rose $21.3 billion or 4.6% to $479.5 billion. This followed a 10.0% June increase.

Unfilled orders, which have been down four of the last five months, fell $8.3 billion or 0.8% to $1,084.3 billion. That’s after a decline of 1.4% in June. The unfilled orders-to-shipments ratio was 6.70, down from 7.01.

Inventories are down after two consecutive monthly increases, falling $3.1 billion, or 0.5% to $687.2 billion. That followed a 0.5% increase in June. The inventories-to-shipments ratio was 1.43, down from 1.51 in June.

Factory orders, or new orders for manufactured

S&P 500 Posts 22nd Record Close for 2020, NASDAQ Posts 42nd Record and Fastest 1,000-Point Gain Ever

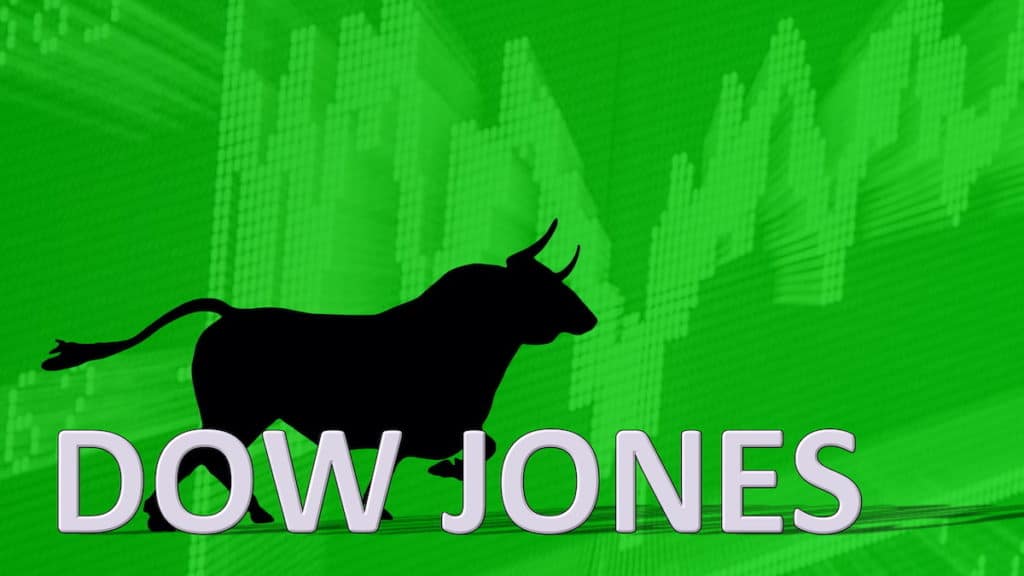
Graphic concept of the Dow Jones Industrial Average (^DJI) behind a black bull pointing to a green ascending chart symbolizing a bullish market. (Photo: AdobeStock)

New York, New York (PPD) — U.S. equity markets soared higher on Wednesday amid optimism a vaccine for coronavirus (COVID-19) could come as early as the fall. The New York Times reported on vaccine process citing the U.S. Centers for Disease Control and Prevention (CDC), optimism People’s Pundit Daily (PPD) can confirm.

The Dow Jones Industrial Average (^DJI) closed above 29,000, or +454.84 (1.59%) to 29,100.50. That’s the best daily gain in 7 weeks, or since July 14, and 450 points off its all-time closing high at 29,551.42.

The S&P 500 (^SPX) closed +54.19 (1.54%) at 3,580.84. That marks the twenty-second record close for 2020 and the best day for the index since June 16.

The NASDAQ Composite (^IXIC) closed +116.78 (0.98%) at 12,056.44, the fastest 1,000-point gain on record. That marks the forty second record close for the index for 2020. The Russell 2000 (^RUT) closed +13.71 (0.87%) higher at 1,592.29.

The White House launched “Operation Warp Speed” to fund five coronavirus vaccines, three of which have shown promise. The Trump Administration announced a historic deal with Pfizer, Inc. (PFE) in late July to secure 100 million doses of a vaccine.

Nearly half a billion more could potentially follow once approved and manufactured. PPD can confirm the progress at Pfizer, which could lead to distribution earlier-than-anticipated as reported by The New York Times.

President Donald Trump took a victory lap on Twitter and a jab at his Democratic rival, former Vice President Joe Biden. During the swine flu epidemic in 2009, the Obama Administration failed at hitting their vaccine targets, and the vaccine led to complications, serious side-effects and civil suits.

The Dow surged to close above 29,000,

People's Pundit Daily
You have %%pigeonMeterAvailable%% free %%pigeonCopyPage%% remaining this month. Get unlimited access and support reader-funded, independent data journalism.

Start a 14-day free trial now. Pay later!

Start Trial