Widget Image
Follow PPD Social Media
Saturday, January 11, 2025
HomeStandard Blog Whole Post (Page 94)

Mexico Previously Would Not Accept “Safe Third Country” Agreement
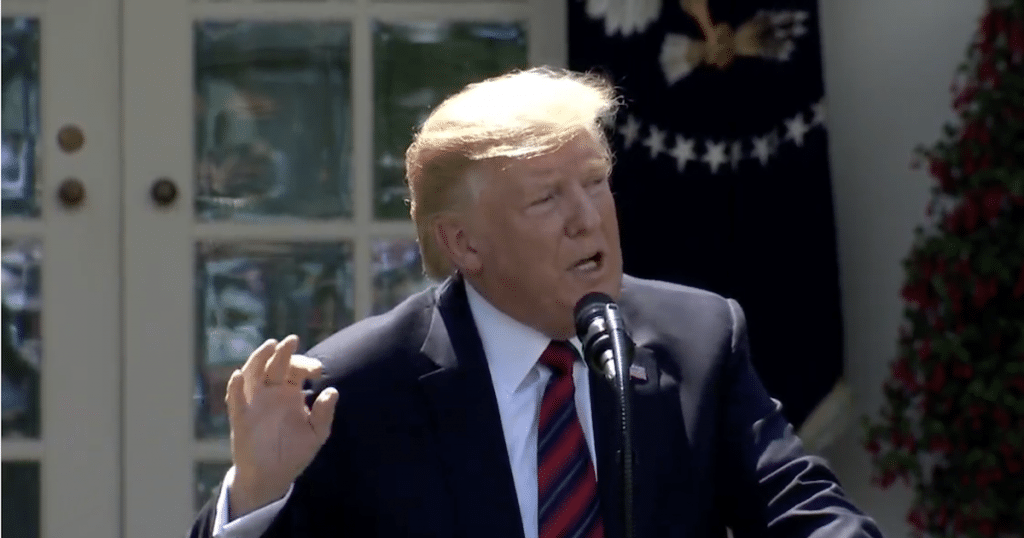
President Donald Trump delivers remarks to unveil his plan to modernize the immigration system at the White House on May 16, 2019. (Photo: PPD)

Mexican officials have agreed to an outline of an unsettled deal to increase immigration enforcement and allow the U.S. to deport bogus asylum-seekers. In a show of good faith and with the hope of avoiding tariffs, Mexican officials will deploy 6,000 troops to the nation’s border with Guatemala on Monday.

On May 31, President Donald Trump announced the U.S. would impose a 5% tariff on imports from Mexico as a result of record numbers of illegal immigrants crossing the southern border. The President said the tariffs will “gradually increase” and will remain until the flow stops.

“On June 10th, the United States will impose a 5% Tariff on all goods coming into our Country from Mexico, until such time as illegal migrants coming through Mexico, and into our Country, STOP,” President Trump tweeted. “The Tariff will gradually increase until the Illegal Immigration problem is remedied at which time the Tariffs will be removed.”

The announcement came as record numbers of coached asylum-seekers have poured over the U.S. southern border. Immigration enforcement officials say the crisis has reached critical mass.

On May 29, 2019, border patrol agents apprehended the largest group of illegal immigrants ever. In total, 1,036 people illegally crossed the border in El Paso around 4:00 am local time.

The plan essentially requires Mexico to enforce existing asylum rules. Central Americans allegedly seeking refuge must do so in the first nation they enter after leaving their native country.

It is known as a “Safe Third Country” agreement. Mexico has repeatedly stated they would not accept such an agreement. But that was before the tariff threat.

Guatemalans, who are required to stay Mexico, have been allowed to travel through the country to the U.S. border. Nationals from Honduras and El Salvador would first enter into Guatemala, whose met last week with Acting Homeland Security Secretary Kevin McAleenan.

Those who do make it to the U.S. southern border will be deported to the appropriate country.

Meanwhile, the President’s allies at home have mixed feelings about the strategy to use tariffs to compel Mexico to behave like an ally on illegal immigration.

Senator Lindsey Graham, R-S.C., Chairman of the Senate Judiciary Committee, introduced legislation to end the legal loophole allowing illegal entries to remain in the U.S. without valid asylum claims.

The Chairman, who supports the tariffs strategy, said the U.S. Senate will vote on the measure within two weeks. But others in the party are scheming to undermine the President in the Republican-held upper chamber, which he ensured would remain in GOP hands.

The President has publicly supported Senator Graham’s bill. But it is unclear whether he will accept the terms of the framework deal with Mexico.

UPDATE President Trump on Saturday announced the deal on Twitter.

To avoid tariffs, Mexico agreed to an
Declining U.S. Trade Deficit With China, Other Countries-Areas, Boosting GDP

U.S.-China trade and trade war concept illustrated by vector of two cargo ships. (Photo: AdobeStock)

In the first quarter (Q1) of 2019, the politically-sensitive U.S.-China trade deficit for goods and services narrowed significantly by $22.9 billion to $80.8 billion. That’s the narrowest U.S. trade deficit with China since Q1 2017.

Exports from the U.S. to China rose by $4.9 billion to $41.4 billion, while imports declined $18.0 billion to $122.2 billion.


YearQ1Q2Q3Q4U.S.-China Trade Balance on Goods/Services (SAAR)
2017-79,862-84,282-83,402-89,658$-337,204
2018-92,188 -87,931-96,977-103,708$-380,804
2019-80,789$-80,789

The Commerce Department reported Thursday the U.S. trade deficit declined $1.1 billion to only $50.8 billion, meeting the consensus forecast. In April, exports were $206.8 billion, or $4.6 billion less than in March. Imports were down $5.7 billion to $257.6 billion.


IndicatorPriorPrior RevisedConsensus ForecastForecast RangeActual
Trade Balance (Q1 2019)$-50.0 B$51.9$-50.8 B$-52.7 B to $-50.1 B$50.8

A positive trade balance is referred to as a surplus, meaning the value of exports out of a country exceeds the value of imports into the country. A negative trade balance is referred to as a deficit, or colloquially, a gap. It means the values of imports exceeds the value of exports.

In May, President Donald Trump announced the U.S. hiked tariffs on China from 10% to 25%, a sharp increase worth more than $200 billion amid ongoing trade negotiations. The Chinese pulled back on a nearly-closed deal after Joe Biden entered the race for the 2020 Democratic nomination.

Beijing believes the former vice president will be less inclined to pursue more favorable trade deals for the U.S. China was holding out hope he’d run, and foreign leaders encouraged him to do so.

Fair traders such as the president argue a positive balance of trade or surplus is the more favorable economic state. It indicates a country enjoys a net inflow of capital from foreign markets into their domestic economy. Surpluses also reduces risk to currency manipulation by giving a nation control over the majority of its currency in the global economy.

Regardless, negative trade balances have a negative impact on gross domestic product (GDP).

The Bureau of Economic Analysis (BEA) second estimate for Q1 2019 gross domestic product (GDP) came in at 3.1%, beating the consensus forecast. While the advance estimate for Q1 2019 GDP was 3.2%, both readings have beaten their respective consensus forecasts.

The declining trade deficit represented slightly more than a entire percentage point in the advance and second GDP estimates for Q1 2019.

Meanwhile, Wall Street and the District of Columbia (D.C.) have largely opposed the president’s tariff strategy, despite a clear narrowing of the trade gap both over and between the two nations. U.S. markets initially reacted negatively to the announcement in late May, but are now rebounding.

On Monday, Dow Jones Industrial Average (^DJI) gained +512.40 points or +2.1% to 25332. On Thursday, following the report on international trade and goods, the Dow was trading in the green +47.68 (0.19%).

The S&P 500 (^SPX), which closed +58.82 or +2.2% and posted its second best day of gains for 2019 on Monday, is in the green +8.36 (0.30%). The NASDAQ Composite (^IXIC), which gained +194.10 points or +2.7% to 7527.12 on Monday, is the only major average in the red at −7.44 (0.098%).

In Shanghai, the SSE Composite Index (^SSE) closed overnight −33.62, or 1.17% to 2,827.80. It was trading at 2,939.21 prior to the latest round of tariffs.

In the first quarter (Q1) of 2019,

Compensation Gains, Slightly Offset Decline in Unit Labor Costs

A collage graphic concept for industry and labor. (Photo: AdobeStock)

Nonfarm business sector labor productivity increased solidly at 3.4% in the first quarter (Q1) of 2019, meeting a strong consensus forecast. The gain reflects a 3.9% increase in output and a 0.5% increase in hours worked.

IndicatorPriorConsensus ForecastForecast RangeActual
Labor Productivity – Q/Q ∆ – SAAR3.6%3.4%3.4% to 3.6%3.4%
Labor Costs – Q/Q ∆ – SAAR-0.9%-0.8%-1.4% to -0.3%-1.6%

From Q1 2018 to Q1 2019, productivity rose 2.4%, fueled by a 3.9% increase in output and a 1.5% increase in hours worked. The four-quarter increase in productivity is the largest since a 2.7% gain in the Q3 2010.

Unit labor costs in the nonfarm business sector fell 1.6% in Q1 2019, and has declined by 0.8% over the last four quarters. That’s the lowest four-quarter rate since a 1.7% decline in Q4 2013.

While compensation continued to rise, it only helped to offset output.

Unit labor costs is calculated as the ratio of hourly compensation to labor productivity. Increases in hourly compensation tend to increase unit labor costs, while increases in output per hour tend to reduce them.

Nonfarm business sector labor productivity rose solidly

4-Week Average Declines to 215K

Mr Assange, sporting a long white beard and wagging a finger, shouted "UK must resist" as he was carried out in handcuffs by seven men and hauled into a police van.
U.S. jobless claims graph on a tablet screen. (Photo: AdobeStock)

The Labor Department said initial jobless claims came in at a seasonally adjusted 218,000, unchanged from the prior week and slightly higher than the consensus forecast.

The 4-week moving average was 215,000, a decrease of 2,500 from the previous week’s revised average.

IndicatorPriorPrior RevisedConsensus ForecastForecast RangeActual
Initial Jobless Claims215 K218 K215 K212 K to 216 K218 K
4-Week Average216.75 K217.5 K215 K

No state was triggered “on” the Extended Benefits program during the week ending May 18.

In lagging data, the advance seasonally adjusted insured unemployment rate was unchanged at a very low 1.2% for the week ending May 25.

The advance number for seasonally adjusted insured unemployment for the week ending May 25 came in at 1,682,000, an increase of 20,000. The 4 week moving average was 1,672,750, a decrease of 1,000.

The highest insured unemployment rates in the week ending May 18 were in Alaska (2.2), California (1.9), New Jersey (1.9), Connecticut (1.7), Puerto Rico (1.7), Pennsylvania (1.5), Rhode Island (1.5), Virgin Islands (1.5), Illinois (1.4), Massachusetts (1.4), and Washington (1.4).

The largest increases in initial claims for the week ending May 25 were in Michigan (+2,537), Missouri (+1,046), New York (+875), New Jersey (+874), and California (+847), while the largest decreases were in Ohio (-3,273), Pennsylvania (-2,067), Florida (-250), Arizona (-151), and Indiana (-104).

4-Week Average Declines to 215K U.S. jobless claims

Import, Export, Logistics concept - Map global partner connection of Container Cargo freight ship for Logistic Import Export background (Photo: AdobeStock/Elements of this image furnished by NASA)
Import, Export, Logistics concept – Map global partner connection of Container Cargo freight ship for Logistic Import Export background (Photo: AdobeStock/Elements of this image furnished by NASA)

The U.S. trade deficit for goods and services narrowed $1.1 billion in April to just $50.8 billion, meeting the consensus forecast. The continued narrowing of the trade balance — which media analysts did not expect — will be a net positive for gross domestic product (GDP).

The month of March was revised slightly higher to $51.9 billion.

IndicatorPriorPrior RevisedConsensus ForecastForecast RangeActual
Trade Balance$-50.0 B$51.9$-50.8 B$-52.7 B to $-50.1 B$50.8

In April, exports were $206.8 billion, or $4.6 billion less than in March Imports were down $5.7 billion to $257.6 billion.

The decrease in the U.S. trade deficit for goods and services reflected a $1.0 billion decrease in the goods deficit to $71.7 billion and a $0.1 billion increase in the services surplus to $20.9 billion.

3-Month Moving Averages for Trade Balance

The average goods and services deficit fell $0.6 billion to $50.9 billion for the three months ending in April. The average for exports declined $0.2 billion to $209.3 billion, while imports fell $0.8 billion to $260.2 billion.

U.S. Trade Deficit With China Amid Trade War

The politically-sensitive U.S. trade deficit with China decreased $22.9 billion to $80.8 billion in Q1 2019. Exports rose $4.9 billion to $41.4 billion and imports declined $18.0 billion to $122.2 billion.

In May, President Donald Trump announced the U.S. increased tariffs on China from 10% to 25%, a sharp increase worth more than $200 billion amid ongoing trade negotiations.

While Wall Street and D.C. have largely opposed the president’s tariff strategy, the trade gap between the two nations is clearly narrowing. U.S. markets reacted negatively to the announcement, but are rebounding.

In Shanghai, the SSE Composite Index (^SSE) closed −33.62, or 1.17% to 2,827.80. It was at 2,939.21 prior to the latest round of tariffs.

U.S. Trade Deficit With Selected Countries, Areas

CountryTrade Balance
South / Central America$22.3 B
Brazil$8.1 B
Hong Kong$7.4 B
OPEC$6.6 B
United Kingdom$5.0 B
Singapore$4.2 B
Canada$4.0 B
Saudi Arabia$1.0 B
China-$80.8 B
European Union-$28.4 B
Mexico-$23.0 B
Germany-$16.7 B
Japan-$15.6 B
Italy-$9.4 B
India-$7.1 B
Taiwan-$5.0 B
France-$4.6 B
South Korea-$4.1 B

The U.S. trade deficit for goods and

On Liberty Never Sleeps, Tom wraps up the week discussing the penalties of freedom in the context of the 75th Anniversary of D-Day.

The money pledged thru Patreon.com will go toward show costs such as advertising, server time, and broadcasting equipment. If we can get enough listeners, we will expand the show to two hours and hire additional staff.

To help our show out, please support us on Patreon.

All bumper music and sound clips are not owned by the show, are commentary, and of educational purposes, or de minimus effect, and not for monetary gain.

No copyright is claimed in any use of such materials and to the extent that material may appear to be infringed, I assert that such alleged infringement is permissible under fair use principles in U.S. copyright laws. If you believe material has been used in an unauthorized manner, please contact the poster.

On Liberty Never Sleeps, Tom wraps up

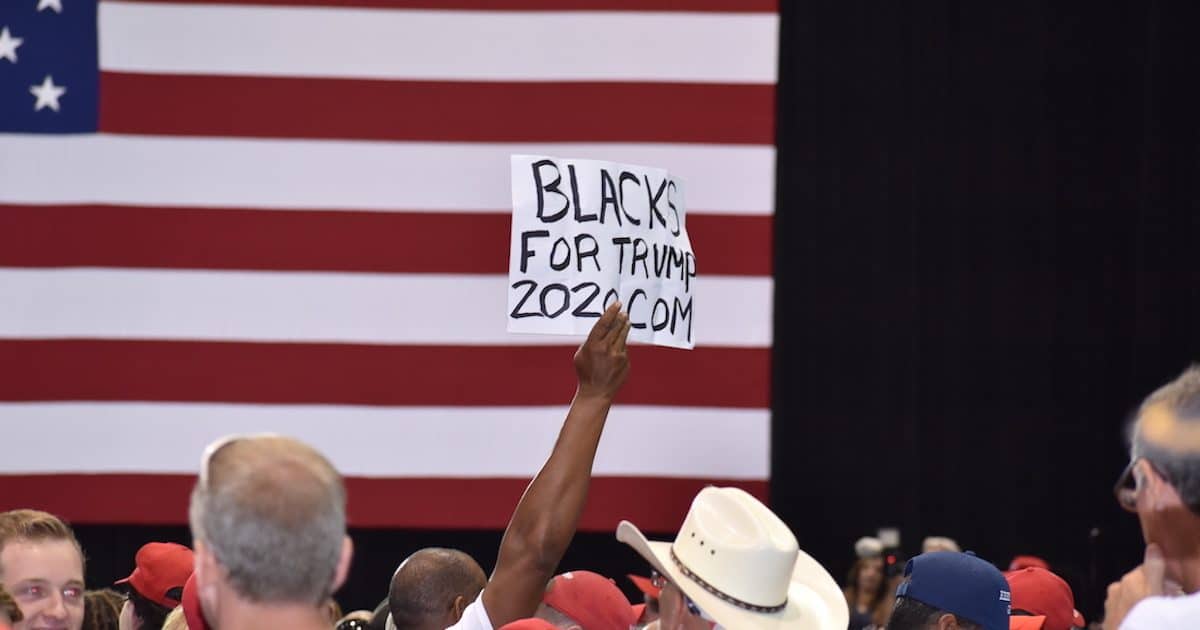
An African American supporter of President Donald Trump holds up a Black for Trump sign during a rally in Tampa, Florida on Tuesday, July 31, 2018. (Photo: Laura Baris/People's Pundit Daily)
An African American supporter of President Donald Trump holds up a Black for Trump sign during a rally in Tampa, Florida on Tuesday, July 31, 2018. (Photo: Laura Baris/People’s Pundit Daily)

In May 2018, I wrote Black Support For Trump is Rising Into The Danger Zone For Democrats in The Federalist. The analysis was based on a series of YouGov/The Economist Polls tracking black voters approval of President Donald Trump during a period of an improving economy and “the lowest level of black unemployment in history.”

I wanted to see if this undoubted economic revival — which was benefiting all minorities — would, as it did in 1936 under FDR, translate into growing support.

It would not be expected that a massive shift would take place. It took black voters two elections to move from decades of support for the GOP to the Democratic Party. But given the sharply polarized electorate even a relatively small block of voters moving across party lines could have a massive effect on the Electoral College.

Thirteen months of YouGov/The Economist Polls — including highs marked by periods of economic benefits and lows marked by Charlottesville — aggregated to a 16% approval level. The last four months were in the 15% to 16% range, each month.

This is 100% above what then-candidate Trump received in 2016. Of course “approval” is not the same as actual votes cast but, as logical as these things can be, if even half of the approval supports above the 8% turns into 2020 votes, then the Electoral College possibilities for Trump are profound.

The president won in 2016 earning 8% of the black vote nationwide. If he received 12% in 2020, then Michigan, Florida, North Carolina and Pennsylvania would be locks. Unlike Detroit (Michigan), the black vote nearly maxed out for Hillary in Philadelphia (Pennsylvania).

How are things looking a year later?

If they were rising into the danger zone a year ago, then new polling shows they are well and truly into it.

Regrettably not all major polls break down their results by ethnicity/race but enough do to give a substantial impression, especially when the results are remarkably consistent.

PollApproval Among Black Voters
YouGov/The Economist19%
The Hill/Harris20%
HarrisX18%
YouGov19%

The aggregate of these four polls is 19%, or 3 percentage points above the aggregate for May 2018. Whatever one might think of each pollster, it is fair to consider there must be validity in these black voters samples with the toplines from 17 polls from different pollsters over a period of a year all showing the same range, within a few points.

Apart from the strong economy and historically low black unemployment rates, the left’s “Trump is a racist” meme has shown to be empty rhetoric, especially with the president issuing a series of pardons and sentence commutations to high-profile historic and present figures.

There has arisen the “Walkaway” movement urging black voters to leave the Democratic Party led by the rise of the intensely serious and credible Candace Owens and the much-publicized positive interaction between President Trump and Kanye West.

It is remarkable that both the Democrats and the leftist media are ignoring these results. It is possible to dismiss polls, though it would take a substantial degree of spin to dismiss so many. But actual voting can’t be so lightly dismissed.

In the case of two very high-profile midterm races — the Florida and Georgia gubernatorial contests — two black Democrats went down to defeat in tight races in no smart part due to black voters supporting white Republicans in higher numbers.

In Florida, Andrew Gillum narrowly lost. Black females, the admitted rock-solid core for the Democratic Party, voted for Ron DeSantis in higher than usual numbers.

In Georgia, enough black men voted against Stacey Abrams to ensure her defeat, whether she admits she lost or not. To switch allegiance because of issues when previously the party glue was too strong to allow any such action, is a warning the old days may be over.

If current polling showing black support for President Trump has indeed more than solidified at 16% but actually ticked up to 19%, and if even half of that increase above 8% translates into actual votes, then the possibility of a historic realignment would be underway. That potential is allied with the clear social and economic trends outlined above.

The consequences for the Democratic Party would be cataclysmic.

You Might Also Like

The aggregate approval rating for Donald Trump

NMI: Business Activity Rose to 61.2%, New Orders Gained to 58.6%, and Employment Increased to 58.1%

A Walmart employee who serves as a "customer host," walks in front of the customer service desk at a Walmart super-center location in Gainesville, Florida. (Photo: Laura Baris/People's Pundit Daily/PPD)
A Walmart employee who serves as a “customer host,” walks in front of the customer service desk at a Walmart super-center location in Gainesville, Florida. (Photo: Laura Baris/People’s Pundit Daily/PPD)

The Institute for Supply Management (ISM) Non-Manufacturing Index (NMI) for the U.S. service sector came in at 56.9 for May, beating the consensus forecast. That’s a gain of 1.4 percentage points from April, and indicates continued service sector growth at a slightly faster rate.

IndicatorPriorConsensus ForecastForecast RangeActual
NMI Composite Index – Level55.5 55.8 52.5  to 56.5 56.9 

The Non-Manufacturing Business Activity Index rose 1.7% to 61.2%, suggesting growth for the 118th consecutive month. The New Orders Index posted a slightly higher (0.5%) reading at 58.6%. The Employment Index rose 4.4% to 58.1% , while the Prices Index fell 0.3% from 55.7% to 55.4%, indicating that prices increased in May for the 24th consecutive month.

“According to the NMI, 16 non-manufacturing industries reported growth,” Anthony Nieves, Chair of the ISM Non-Manufacturing Business Survey Committee. “The non-manufacturing sector continues to experience a slight uptick in business activity, but it is still leveling off overall.”

“Respondents are mostly optimistic about overall business conditions, but concerns remain about tariffs and employment resources.”

The Institute for Supply Management (ISM) Non-Manufacturing

Did the Biden Campaign Plagiarize Under Pressure from Greenpeace?

Former Vice President Joe Biden speaks during the Milken Institute Global Conference in Beverly Hills, California, U.S., May 3, 2017. (Photo: Reuters)

Lifted Climate Plan Praising Green New Deal Bumped Biden From ‘D-‘ to ‘B’ on Greenpeace Scorecard

Joe Biden is once again facing charges of plagiarism. Several passages in his newly-released $1.7 trillion climate change plan, which praises the Green New Deal, appear to have been lifted from non-profits.

Further, the plagiarism-plagued climate change plan was released only days after Greenpeace USA gave him a D- on their report card and pressed him for a proposal. The timeline raises the question of whether the campaign hastily put together and published the plan for political expediency.

The leftwing group CREDO Action first accused the former vice president and current 2020 Democratic frontrunner of copying passages from Blue Green Alliance and the Carbon Capture Coalition.

“The paragraph in Joe Biden’s climate plan about carbon capture and sequestration includes language that is remarkably similar to items published previously by the Blue Green Alliance and the Carbon Capture Coalition,” Josh Nelson, the Vice President at CREDO tweeted.

Vox, The Daily Caller, American Rivers, and Climate.gov have since piled on with their own allegations that significant parts of the plan were plagiarized.

“Several citations, some from sources cited in other parts of the plan, were inadvertently left out of the final version of the 22 page document,” a spokesperson for the Biden Campaign wrote POLITICO in an email. “As soon as we were made aware of it, we updated to include the proper citations.”

Mr. Biden has long been plagued by charges of plagiarism.

In 1987, Mr. Biden’s first presidential campaign was derailed by a series of plagiarism scandals. He was caught plagiarizing passages from Robert Kennedy, Hubert Humphrey and British Labor leader Neil Kinnock.

He also plagiarized while attending law school at Syracuse. The New York Times reported at the time Mr. Biden “used five pages from a published law review article without quotation or attribution.”

The plan was released by the Biden Campaign on Tuesday as an effort to placate the far-left shift in his party. Interestingly, it was published only days after Greenpeace released their new evaluations for 19 candidates on May 30.

In Bernie Soars and Biden Stumbles in New Greenpeace Ranking of 2020 Candidates’ Climate Platforms, the socialist senator from Vermont initially led the pack with a “B+” grade. Mr. Biden was initially dead last, receiving a D- on his climate change report card.

“If he [Biden] wants to translate his front-runner status in the polls to actual leadership on climate, we need him to come out with a bold, concrete plan in line with the scale of the crisis we’re facing,” Greenpeace USA Climate Campaign Director Janet Redman, said.

The scorecard rates candidates based on commitments to ending fossil fuels, prior statements in support of various policies, legislative records and published proposals. The organization said some candidates also filled out a 29-question survey.

In the proposal, Mr. Biden embraced the Green New Deal as “a crucial framework” to his climate change agenda. The plan would also repeal the Tax Cuts and Jobs Act (TCJA), President Donald Trump’s signature achievement and the first overhaul to the U.S. tax code in 31 years.

While that may appeal to younger voters in the party’s coalition, it threatens to turn off working class voters.

The environmental activist wing of the Democratic Party supports the Green New Deal and has used it as a litmus test for candidates. However, labor unions and workers do not.

The AFL-CIO denounced it as a job and wage killer.

Cecil Roberts, president of the United Mine Workers of America, and Lonnie Stephenson, president of the International Brotherhood of Electrical Workers, said proposals in the Green New Deal are “threats to our members’ jobs and their families’ standard of living.”

Consequently, Greenpeace revealed amid the controversy that Mr. Biden’s climate change plan “helped him achieve a new grade of ‘B,’ moving him into seventh place ahead of Beto O’Rourke and behind Tulsi Gabbard.”

Governor Jay Inslee, D-Wa., now leads the climate change scorecard with an A-. President Donald Trump received an F. He scored zero out of a possible 100 points.

UPDATE: Less than 24 hours after allegations the Biden Campaign plagiarized the climate change plan, it has come to light that his education plan contains several lifted passages. The Washington Post reported “Biden used a sentence word for word from an education policy publication from the group XQ Institute.”

“Joe Biden’s presidential campaign lifted language without credit, at times word for word, when crafting its education and climate plans, incidents the campaign acknowledged and said were inadvertent.”

Joe Biden's plagiarism-plagued climate change plan was

Stocks Rally, S&P 500 Posted Second Best Day for Gains in 2019

Wall Street at the New York Stock Exchange (NYSE), the world's largest stock exchange by market capitalization of listed companies. (Photo: AdobeStock)
Wall Street at the New York Stock Exchange (NYSE), the world’s largest stock exchange by market capitalization of listed companies. (Photo: AdobeStock)

Stocks rallied from bell-to-bell on Tuesday, as investors were encouraged by subtle yet positive snippets on the trade front and, more significantly, signs that the Federal Reserve is shifting from a neutral posture to a stance where at least 1 interest rate cut later in the year is likely.

The Dow Jones Industrial Average (^DJI) gained +512.40 points or +2.1% to 25332. The S&P 500 (^SPX) closed +58.82 or +2.2% and posted its second best day of gains for 2019. The NASDAQ Composite (^IXIC) gained +194.10 points or +2.7% to 7527.12.

Renewed trade optimism and dovish undertones from Fed Chairman Jerome Powell erased Monday’s sharp decline, outweighing potential regulatory oversight issues on internet search and delivery behemoths that had dominated the headlines of late.

As a testament to how decisively investor sentiment can turn on a dime, the DJIA, S&P 500 and NASDAQ each recouped one-third of their losses for the entire month of May, the first month of negative market returns this year.

They also each regained psychological if not exact technical benchmarks: 25,000 for DJI, 2,800 for the S&P 500 and 7,500 for the Nasdaq.

Clearly, stocks had been approaching oversold status toward the end of last month when the prospect of tariffs on all imports from Mexico sparked a final “piling on” wave of selling, which wiped out any chance of a late-month bounce.

While Monday showed signs the selling pressure was near the exhaustion point, there is no doubt the predominate catalyst for the strength and breadth of the rally was attributable to the perception of a shift in FED policy. That was turbo charged by comments from Chairman Powell that kicked off a two-day conference on monetary policy hosted by the Federal Reserve Bank of Chicago.

Chairman Powell said 2 very important things, while mentioning the uncertainty surrounding the resolution of current trade negotiations.

  • “We do not know how or when these issues will be resolved.”
  • “We are closely monitoring the implications of these developments for the U.S. economic outlook and, as always, we will act as appropriate to sustain the expansion.”

The emphasis was rightly put on “we will act as appropriate to sustain the expansion.”

Additionally, he also made this profound and somewhat overlooked statement: “The proximity of interest rates to the Effective Lower Bound; ELB, has become the preeminent monetary policy challenge of our time.”

In English, this means, an inverted yield curve is unacceptable.

The weight behind these comments cannot be understated, nor can their potential impact on investor sentiment be underestimated.

Never mind that the ADP private sector jobs report this morning came in well below consensus, as that will likely just provide fuel for the “rate cut mantra” bombarding the FED and the bond market.

We will be paying close attention to the 2:00 PM release of the FEDs Beige Book for June that details economic activity for the 12 Federal Reserve Bank regions.

Stay Tuned!!

Stocks rallied from bell-to-bell on Tuesday as

People's Pundit Daily
You have %%pigeonMeterAvailable%% free %%pigeonCopyPage%% remaining this month. Get unlimited access and support reader-funded, independent data journalism.

Start a 14-day free trial now. Pay later!

Start Trial